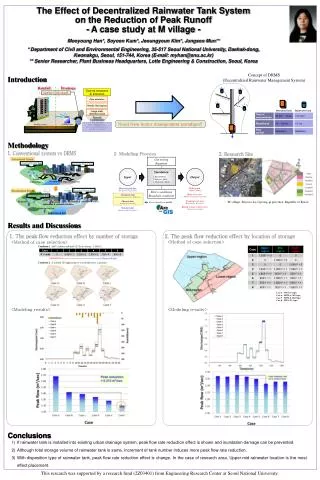
The Peak Effect
The Peak Effect. Gautam I. Menon IMSc, Chennai, India. Type-II Superconductivity. The mixed (Abrikosov) phase of vortex lines in a type-II superconductor. The peak effect is a property of dynamics in the mixed phase. Structure of a vortex line. How are forces exerted on vortex lines?.

The Peak Effect
E N D
Presentation Transcript
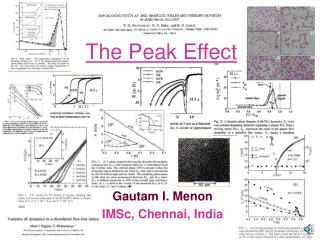
The Peak Effect Gautam I. Menon IMSc, Chennai, India
Type-II Superconductivity The mixed (Abrikosov) phase of vortex lines in a type-II superconductor The peak effect is a property of dynamics in the mixed phase Structure of a vortex line
How are forces exerted on vortex lines? How do vortex lines move under the action of an external force?
Lorentz Force on Flux Lines Force/unit volume Local supercurrent density Local induction Magnetic pressure Tension along lines of force
Dissipation from Line Motion Viscous forces oppose motion, damping coefficient g, lines move with velocity v Competition of applied and viscous forces yields a steady state, motion of vortices produces an electric field Power dissipation from EJ, thus nonzero resistivity from flux flow
Random Pinning Forces • To prevent dissipation, pinlines by quenched random disorder • Line feels sum of many random forces • Summation problem: Adding effects of these random forces. How does quenched randomness affect the crystal?
Elasticity and Pinning compete In the experimental situation, a random potential from pinning sites The lattice deforms to accommodate to the pinning, but pays elastic energy Pinning always wins at the largest length scales: no translational long-range order (Larkin)
Depinning • From random pinning: critical force to set flux lines into motion • Transition from pinned to depinned state at a critical current density • Competition of elasticity, randomness and external drive
The Peak Effect Critical force to set the flux line system into motion The Peak Effect refers to the non-monotonic behavior of the critical force/current density as H or T are varied
Larkin Lengths • At large scales, disorder induced relative displacements of the lattice increase • Define Larkin lengths
Estimating Jc Pinning induces Larkin domains. External drive balances gain from domain formation. collective pinning theory Larkin and Ovchinnikov J. Low Temp. Phys34 409 (1979) Role of the Larkin lengths/Larkin Volume
Critical Current density Magnetic Field No peak effect T.G. Berlincourt, R.D. Hake and D.H. Leslie
Surface Plot of jc The peak effect in superconducting response Rise in critical currents implies a drop in measured resistivity
Why does the peak effect occur? Many explanations …
The Pippard Mechanism • Pippard: Softer lattices are better pinned [Phil. Mag. 34 409 (1974) • Close to Hc2, shear modulus is vastly reduced (vanishes at Hc2), so lines adjust better to pinning sites • Critical current increases sharply
PE as Phase Transition? • Shear moduli also collapse at a melting transition • Could the PE be signalling a melting transition? (In some systems …) • Disorder is crucial for the peak effect. What does disorder do to the transition?
Peak Effects in ac susceptibility measurements Sarkar et al. Dips in the real part of ac susceptibility translate to peaks in the critical current
Will concentrate principally on transport measurements G. Ravikumar’s lecture: Magnetization, susceptibility
Peak Effect in Transport: 2H-NbSe2 Peak effect probed in resistivity measurements Fixed H, varying T; Fixed T varying H
Nonlinearity, Location A highly non-linear phenomenon Transition in relation to Hc2
In-phase and out-of-phase response • Apply ac drive, measure in phase and out-of-phase response • Dip in in-phase response, peak in out-of-phase response: superconductor becomes more superconducting • Similar response probed in ac susceptibility measurements
Systematics of I-V Curves I-V curves away from the peak behave conventionally. Concave upwards. Such curves are non-trivially different in the peak regime
IV curves and their evolution Differential resistivity Evolution of dynamics Peak in differential resistivity in the peak region IV curves are convex upwards in the peak region
Fingerprint effect • Differential resistivity in peak regime shows jagged structure • Reproducible: increase and lower field • Such structure absent outside the peak regime • Power-laws in IV curves outside; monotonic differential resistivity
Interpretation of Fingerprints? • A “Fingerprint” of the structure of disorder? • Depinning of the flux-line lattice proceeds via a series of specific and reproducible near-jumps in I-V curves • This type of finger print is the generic outcome of the breaking up of the flux-line lattice due to plastic flow in a regime intermediate between elastic and fluid flow (Higgins and Bhattacharya)
Noise • If plastic flow is key, flow should be noisy • Measure frequency dependence of differential resistivity in the peak region • Yes: Anomalously slow dynamics is associated with plastic flow. Occurs at small velocities and heals at large velocities where the lattice becomes more correlated. • A velocity correlation length Lv
Dynamic Phase Diagram • Force on y-axis, thermodynamic parameter on x-axis (non-equilibrium) • Close to the peak, a regime of plastic flow • Peak onset marks onset of plastic flow • Peak maximum is solid-fluid transition
Numerical Simulations • Brandt, Jensen, Berlinsky, Shi, Brass.. • Koshelev, Vinokur • Faleski, Marchetti, Middleton • Nori, Reichhardt, Olson • Scalettar, Zimanyi, Chandran .. And a whole lot more …
Simulations: The General Idea • Interaction – soft (numerically easy) or realistic • Disorder, typically large number of weak pinning sites, but also correlated disorder • Apply forces, overdamped eqn of motion, measure response • Depinning thresholds, top defects, diff resistivity, healing defects through motion, • Equilibrium aspects: the phase diagram
Numerical Simulations Faleski, Marchetti, Middleton: PRE (1996) Depinning as a function of pinning strengths. Differential resistivity Bimodal structure of velocity distributions: Plastic flow
FMM: Velocity Distributions Velocity distributions appear to have two components
Chandran, Zimanyi, Scalettar (CZS) More realistic models for interactions Hysteresis Defect densities Dynamic transition in T=0 flow
CSZ: Flow behaviour Large regime of Disordered flow All roughly consistent with the physical ideas of the dominance of plasticity at depinning
Dynamic Phase Diagram • Predict a dynamic phase transition at a characteristic current • Phase at high drives is a crystal • The crystallization current diverges as the temperature approaches the melting temperature • Fluctuating component of the pinning force acts like a “shaking temperature” Koshelev and Vinokur, PRL(94) .. Lots of later work
Simulations: Summary • We now know a lot more about the depinning behaviour of two-dimensional solids in a quenched disorder background. • Variety of new characterizations from the simulations of plastic flow phenomena • Dynamic phase transitions in disordered systems • Yet .. May not have told us much about the peak effect phenomenon itself
History Dependence in PE region Two distinct states of the flux-line lattice, one relatively ordered one highly disordered. Can anneal the disordered state into the ordered one Henderson, Andrei, Higgins, Bhattacharya Critical Currents differ between FC and ZFC routes
Peak Effect vs Peak Effect Anomalies Tpl Tp Let us assume that the PE is a consequence of an order-disorder transition in the flux line system Given just this, how do we understand the anomalies in the peak regime? The Peak Regime
Zeldov and collaborators: Peak Effect anomalies as a consequence of the injection of a meta-stable phase at the sample boundaries and annealing within the bulk Boundaries may play a significant role in PE physics
The Effects of Sample Edges • Role of barriers to flux entry and departure at sample surfaces • Bean-Livingston barrier • Currents flow near surface to ensure entry and departure of lines • Significant dissipation from surfaces
Corbino geometry:Zeldov and collaborators Surface effects can be eliminated by working in a Corbino geometry. Peak effect sharpens, associated with Hp
Relevance of Edges • Both dc and ac drives • Hall probe measurements • Measure critical currents for both ac and dc through lock-in techniques • Intermediate regime of coexistence from edge contamination
Direct access to currents • Map current flow using Maxwells equations and measured magnetic induction using the Hall probe method • Most of the current flows at the edges, little at the bulk • Dissipation mostly edge driven?
Andreiand collaborators • Start with ZFC state, ramp current up and then down • Different critical current .. • “Jumpy” behavior on first ramp • Lower threshold on subsequent ramps
Plastic motion/Alternating Currents • Steady state response to bi-directional pulses vs unidirectional pulses • Motion if bi-directional current even if amplitude is below the dc critical current • No response to unidirectional pulses Henderson, Andrei, Higgins
Memory and Reorganization I Andrei group
Memory and Reorganization II Response resumes where it left off Andrei group
Generalized Dynamic Phase Diagram More complex intermediate “Phases” in a disordered system under flow
Reentrant Peak Effect • Reentrant nature of the peak effect boundary at very low fields • Connection to reentrant melting? • See in both field and temperature scans • Later work by Zeldov and collaborators TIFR/BARC/WARWICK/NEC COLLABORATION