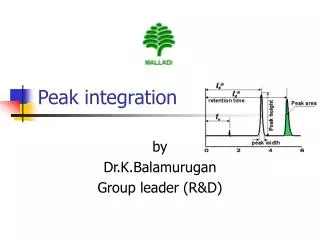
Peak integration
Peak integration. by Dr.K.Balamurugan Group leader (R&D). INTRODUCTION.

Peak integration
E N D
Presentation Transcript
Peak integration by Dr.K.Balamurugan Group leader (R&D)
INTRODUCTION • Peak detection and integration are fundamental tasks in chromatography, most often done using chromatography software. Enabling software to detect and integrate the peaks as desired (or as required by laboratory rules) is challenging. Common challenges in peak detection include: • Distinguishing peaks from noise • Correctly identifying the underlying baseline • Maintaining correct peak and baseline detection throughout a sequence of chromatograms • Correctly handling rider peaks and other unresolved peaks
Peak • Peak is the name originally used by James and Martin to describe the elution curve of a solute which relates solute concentration in the mobile phase with time. This term was obviously evoked by the Gaussian shape of the elution curve.
Topics 1. Required Integration Events • Threshold/slope • Width • Shoulder Sensitivity • Valley to Valley • Split Peak • Tangent Skim • Front Tangent Skim • Negative Peak • Backward Horizontal Baseline • Lowest Point Horizontal Baseline • Force Peak Start /Force Peak Stop • Horizontal Baseline • Minimum Area
2. Interpretation of chromatograms • Relative retention times r • Theoretical plates N • Resolution, R • Signal to noise ratio S/N • Peak to valley ratio p/v • Symmetry factor As • Mass distribution ratio (also known as the capacity factor k' or retention factor k)
3. Case study Question to experts
Required Integration Events • Threshold/slope • Width • This parameter is used to allow the integration algorithm to distinguish the start and stop of peaks from baseline noise and drift. When setting the Threshold value graphically, you select a section of baseline. The recommended Threshold value is based on the highest first value determined in that section of the chromatogram. • The diagram below shows examples of how incorrect values for peak Width and Threshold can effect the peak baseline.
Threshold/slope Width Note that extreme values of both Width and Threshold (too large or too small) can result in peaks not detected.
The Width event is used to calculate a value for bunching, or smoothing, the data points before the integration algorithm is applied. Integration works best when there are 20 points across a peak
Shoulder Sensitivity • This parameter is used to enable the detection of shoulders on larger peaks. A larger value will decrease shoulder sensitivity, while smaller values increase sensitivity to shoulder peaks. When setting the Shoulder Sensitivity value graphically, you select a section of the baseline. The recommended Shoulder Sensitivity value is based on the highest derivative value determined in that section of the chromatogram
Valley to Valley • This event causes the baselines of peaks that are not totally resolved (i.e. do not return to baseline) to be drawn to the minimum point between the peaks. If this event is not used, a baseline is projected to the next point at which the chromatogram returns to baseline, and a perpendicular is dropped for peaks which do not reach baseline
Split Peak • This event is used to force a perpendicular drop-line integration in a peak. The perpendicular will be dropped at the point where the event is inserted.
Tangent Skim • This event is used to integrate a small peak located on the tailing edge of a larger peak. The baseline of the small peak becomes a tangent drawn from the valley of the larger peak to the tangent point on the chromatogram.
Front Tangent Skim • The Front Tangent Skim event is used to force a tangential baseline for a daughter peak on the leading edge of a mother peak.
Negative Peak • This event causes portions of the chromatogram that drop below the baseline to be integrated using the normal peak logic and reported as true peaks. This event is useful when using detectors such as Refractive Index types which give a negative response to certain compounds.
Backward Horizontal Baseline • This event is used to force a horizontal baseline in the direction of the beginning of the chromatogram. A backward horizontal baseline will be created between the times specified by the event.
Lowest Point Horizontal Baseline • This event is similar to the Horizontal Baseline event, except that the lowest point in the chromatogram determines the baseline. The values you input for Start Time and Stop Time determine the region within the chromatogram where the lowest point horizontal baseline will be used.
Force Peak Start /Force Peak Stop • These events are used to force the start or stop of the peak integration to a specific point.
Horizontal Baseline • This event allows you to project the baseline forward horizontally between the times specified for the event.
Minimum Area • This event allows you to enter an area limit for peak detection. Peaks whose areas fall below this minimum area will not be integrated and reported as peaks. This event is useful for eliminating noise or unwanted peaks from your report.
relative retention times • In most procedures there is no need to identify an unretained peak, comparisons are normally made in terms of relative retention times, Rr:
where t 2 and t 1 are the retention times tM is the retention time of a non-retained marker
Theoretical plates: • The number of theoretical plates, N, is a measure of column efficiency. For Gaussian peaks, it is calculated by the equation:
The value of N depends upon the substance being chromatographed as well as the operating conditions such as mobile phase or carrier gas flow rates and temperature, the quality of the packing, the uniformity of the packing within the column and, for capillary columns, the thickness of the stationary phase film, and the internal diameter and length of the column.
Resolution, R: • The separation of two components in a mixture, the resolution, R, is determined by the equation:
Where electronic integrators are used, it may be convenient to determine the resolution, R, by the equation:
Signal to noise ratio • The signal-to-noise ratio (S/N) influences the precision of quantification and is calculated from the equation:
H = height of the peak, measured from the maximum of the peak to the extrapolated baseline of the signal observed over a distance equal to 20 times the width at half-height, h =range of the background noise in a chromatogram obtained after injection or application of a blank, observed over a distance equal to 20 times the width at half-height of the peak in the chromatogram
Peak to valley ratio • The peak-to-valley ratio (p/v) may be employed as a system suitability requirement in a test for related substances when baseline separation between 2 peaks is not reached
Hp =height above the extrapolated baseline of the minor peak, • Hv =height above the extrapolated baseline at the lowest point of the curve separating the minor and major peaks.
Symmetry factor • The symmetry factor (As) (or tailing factor) of a peak is calculated from the expression:
w0.05 = width of the peak at one-twentieth of the peak height, • d = distance between the perpendicular dropped from the peak maximum and the leading edge of the peak at one-twentieth of the peak height. • A value of 1.0 signifies complete (ideal) symmetry.
Mass distribution ratio(also known as the capacity factor k' or retention factor k) The ratio of the adjusted retention volume ( or time ) and the hold-up volume ( or time )
Case study • Q1 • Who and how, one will conclude the selected peak integration parameters (by instrument default or forced by operator) are suitable for a given procedure?? or What data need to be captured wrt peak integration [ where & how is acceptable for authorities
Q2 • When a validated analytical method (with a set of integration parameters) is transferred to the plant are we allowed to change the integration parameters, if yes how/where do we record/report them.
Q3 • Can we change the integration parameters on daily basis, do we follow change control procedure for this change. • 21 CFR Part 11 - Electronic Records and Electronic Signatures http://www.labcompliance.com/tutorial/part11/default.aspx
Q4 • If a method is used on routinely is it ok to change/adjust the peak integration parameters as required for a given day to meet SS requirements ? if yes why ? Can peak integration parameters be changed during a given analysis?