Download
1 / 10
100 likes | 293 Views
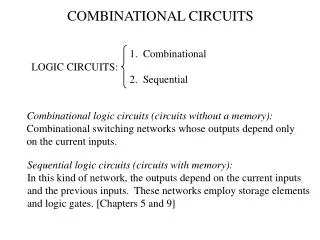
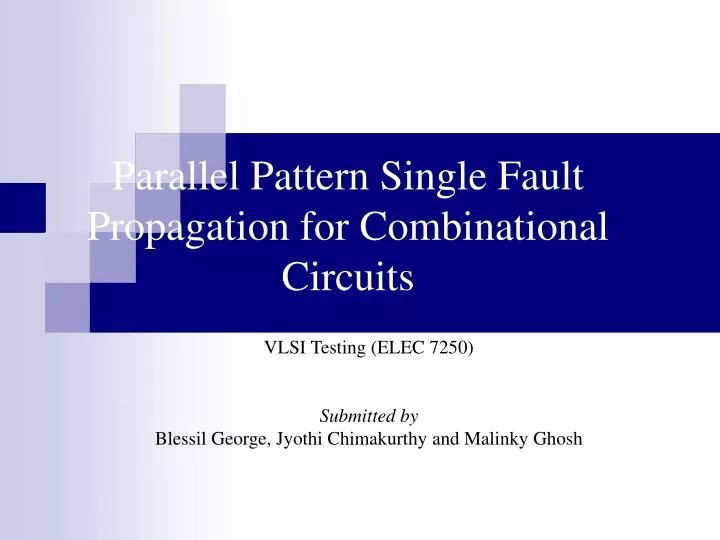
Parallel Pattern Single Fault Propagation for Combinational Circuits. VLSI Testing (ELEC 7250) Submitted by Blessil George, Jyothi Chimakurthy and Malinky Ghosh. Start. Perform Parallel Good ckt. Simulation of next 32 patterns. Select First Fault in fault list.

E N D
Parallel Pattern Single Fault Propagation for Combinational Circuits VLSI Testing (ELEC 7250) Submitted by Blessil George, Jyothi Chimakurthy and Malinky Ghosh
Start Perform Parallel Good ckt. Simulation of next 32 patterns Select First Fault in fault list Propagate Selected Fault Effect Forward from point of Fault Eliminate Fault from List if detectable at Primary Output All Patterns Simulated All Faults Simulated? All Faults Detected ? Select Next Fault Stop Stop Algorithm and Analysis • A two value good machine simulation is performed in parallel for 32 patterns. The output at each logic gate is calculated, ordered such that a gate is calculated only after all its inputs are calculated. The number 32 is the chosen as a compromise between the improved performance and parallelism factor constraint (determined by the ALU size, usually 32 bits). • For each stuck at fault the fault values of all 32 patterns are propagated until faulty circuit values are same as the good circuit values. When fault becomes detectable at an observable point, it’s eliminated from further simulation. • Steps i. and ii. Are repeated until all faults are eliminated.
Storage Format of Input Circuit Two Dimensional array of structures for storing circuit net data • Each column (j) stores the information of each gate • First row stores the gate type in the form of gate code, e.g. NAND corresponds to ’4’, AND corresponds to ‘1’ • The subsequent rows store the data (name and value) of the input and output nets • The output net data is stored in the last row of the particular column • The input nets on each gates can be variable Fig. Sample matrix generated for circuit shown.
Result Discussion • Demonstration is for 7 bits • Stuck at 1 fault type is shown • 127 denotes the stuck at one fault of the net (i.e. bit 1 is inserted on all the 7 vectors/patterns) • The two dimensional array shown does not display the gate type. • Each horizontal row is a gate; last column is the output net of that gate
Result Discussion (contd.) • Result corresponds to the XOR of good circuit and faulty circuit values • When Result not equal to ‘0’ vector is considered to detect fault • When result is ‘0’ good circuit and faulty circuit values are same Fault Simulation Concept
Features • Reads the input circuit in the standard format; No further formatting required. • Identify the firsttest vector t that detects faulton observable output as the test vector, i.e. we do not calculate all the primary outputs once the fault is detected on one of the primary outputs. • Input Circuit needs to be levelised • Does not include test compaction (e.g. Reverse Fault Simulation)
1 PASSES REQUIRED STATE_LIST_SIZE 256 read vector: 1 det faults 6 coverage 0.272727 read vector: 2 det faults 13 coverage 0.590909 read vector: 3 det faults 17 coverage 0.772727 read vector: 4 det faults 19 coverage 0.863636 read vector: 5 det faults 19 coverage 0.863636 read vector: 6 det faults 20 coverage 0.909091 read vector: 7 det faults 21 coverage 0.954545 read vector: 8 det faults 22 coverage 1.000000 read vector: 9 det faults 22 coverage 1.000000 read vector: 10 det faults 22 coverage 1.000000 read vector: 11 det faults 22 coverage 1.000000 read vector: 12 det faults 22 coverage 1.000000 read vector: 13 det faults 22 coverage 1.000000 read vector: 14 det faults 22 coverage 1.000000 read vector: 15 detected 22 tf 22 tef 0 PROOFS Simulator Output
References • N. Gouders, “PARIS: A Parallel Pattern Fault Simulator for Synchronous Sequential Circuits,” IEEE in 1991, pp. 542–545. • Z. Barzilai and B.K. Rosen, ”Comparison of AC Self–Testing Procedures,” Proc. IEEE Internat. Test Conf.,Oct. 1983, pp.89-94. • E.B. Eichelberger et. al., Structured Logic Testing (Book style). Engle wood, NJ: Prentice Hall, 1991, pp. 112–119.