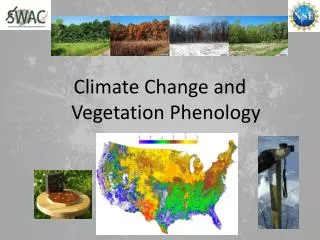
Climate Change and Vegetation Phenology
360 likes | 725 Views
Climate Change and Vegetation Phenology. Climate Change. In the Northeastern US mean annual temperature increased 0.7 ° C over 30 years (0.26 ° C per decade) Expected another 2-6 ° C over next century

Climate Change and Vegetation Phenology
E N D
Presentation Transcript
Climate Change • In the Northeastern US mean annual temperature increased 0.7°C over 30 years (0.26° C per decade) • Expected another 2-6°C over next century (Ollinger, S.V. “Potenail effects of climate change and rising CO2 on ecosystem process in northeastern U.S. forests)
Why does it matter? • Impacts on plant productivity • Competition between plant species • Interaction with other organisms • Food production • Shifts in agricultural • Pest and disease control • Pollen forecasts • Carbon balance of terrestrial ecosystems • Feedback into atmosphere • Water, energy exchange • Timing of migrations and breeding • other ideas?
Phenology is the science that measures the timing of life cycle events in all organisms Plants tell a story about climate…… Listening to the story they tell year after year can tell us about climate change Later Falls Earlier Springs
Plants provide an excellent context to understand changes in the environment They are extremely sensitive to: • temperature change • precipitation change • growing degree days
Phenology: A glimpse of ecosystem Impacts • Some potential effects: • Wildlife populations • Vegetation health • Species composition and ranges • Water availability • Nutrient cycling and decomposition • Carbon storage
Measuring Phenology Field Observations Satellite Remote Sensing
How do scientists monitor vegetation phenology? Tier 1 Intensive Sites AmeriFlux Field Based NWS Coop NPS Inv. & Mon. State Ag. Exp. Sta. Tier 2 Spatially Extensive Science Networks Increasing Process Knowledge Data Quality # of Measurements Decreasing Spatial Coverage Nature Preserves, Campuses Tier 3 Spatially Extensive Volunteer & Education Networks Satellite Based Tier 4 NASA USGS NOAA Remote Sensing and Synoptic (wall-to-wall) Data George R. Kish U.S. Geological Survey
Measuring Phenology on the ground Field Observations
Timing of sugar maple leaf drop Monitored at Proctor Maple Research Center Sandra Wilmot Tom Simmons
Hemispherical Photography Helps us “see” the canopy as a satellite might see it
Hemispherical Imagery • Scientists spend big bucks to purchase the equipment and software necessary to link ground measurements with satellite imagery. • Calculate canopy closure, transparency, leaf area index, vegetation indices, gap fraction, etc.
Measuring Phenology Satellite Remote Sensing Land surface phenologies in 2000 revealed by three AVHRR biweekly composites.” From USA National Phenology Network (USANPN)
How do you see phenology from space? • Chlorophyll, strongly absorbs visible light for photosynthesis. • Leaf cell structure reflects near-infrared light. • NDVI exploits these characteristics of vegetation reflectance to quantify how much, how dense and how productive vegetation is. http://www.fao.org/docrep/003/T0446E/T0446E04.htm
Normalized Difference Vegetation IndexNDVI • Negative values of NDVI correspond to water. • Values close to zero correspond to barren areas of rock, sand, or snow. • low, positive values represent shrub and grassland • high values indicate temperate and tropical rainforests.
Corn/Soy belt Central Illinois Kirsten M. de Beurs, Ph.D. Virginia Tech University
Death Valley What would this NDVI curve look like? Kirsten M. de Beurs, Ph.D. Virginia Tech University
Forest Southwest Virginia What would this NDVI curve look like? Kirsten M. de Beurs, Ph.D. Virginia Tech University
Tundra Northern Alaska What would this NDVI curve look like? Kirsten M. de Beurs, Ph.D. Virginia Tech University
NDVI for Phenological Dates • http://www.seiswaves.com/cappelluti/docs/anims/leicester/ comparison of NDVI values for different dates
Plotting NDVI Use of NDVI to identify key phenological dates Maximum NDVI Rate of Senescence Rate of Greenup Time Integrated NDVI End of Season Start of Season Duration of Season SOS
How do you determine dates? Use of NDVI thresholds to identify key phenological dates Start of the Season http://phenology.cr.usgs.gov/methods_metrics.php
Common Thresholds • 0.5 of the Max:Min NDVI ratio to approximate the start and end of the season EOS Kirsten M. de Beurs, Ph.D. Virginia Tech University
50% Threshold (Seasonal Mid-point) (White et al., mean day = 124, May 4th)
Other key phenological dates http://phenology.cr.usgs.gov/methods_metrics.php