Download
1 / 21
280 likes | 568 Views
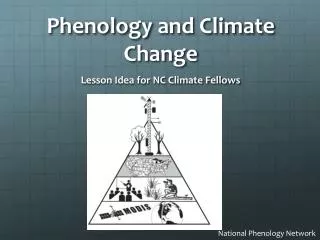
Phenology and Climate Change. Lesson Idea for NC Climate Fellows. National Phenology Network. What is “ phenology ”?. Phenology is the observation and measurement of events in time Biological context: Recurring biological cycles and their connection to climate.

E N D
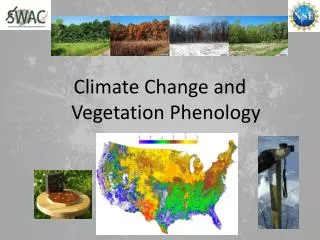
Phenology and Climate Change Lesson Idea for NC Climate Fellows National Phenology Network
What is “phenology”? Phenologyis the observation and measurement of events in time Biological context: • Recurring biological cycles and their connection to climate. • annual bird migrations • insect outbreaks (cicada cycles!) • salmon spawning
Factors that can produce changes in growing season • Temperature • Sunlight (cloudiness) • Available Water • Available Nutrients • Pollution (water and/or air quality) • Disease, infestation
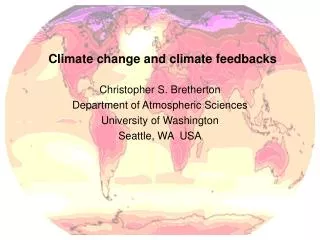
Phenology: indicator of climate change? • Earlier “greening up” may indicate warmer temperatures • Later leaf-fall may indicate warmer temperatures • Earlier leaf-fall may correspond with drier conditions (resulting from many different factors including climate change).
Climate change influences phenology? • Earlier leaf-out and/or later leaf-fall extends growing season • Longer growing season can lead to… • Developing drought conditions - fires • Insect infestation • Diseases • Loss or mismatch of pollinators • Species range changes
How to Study & Climate Change? • Collecting leaf litter to determine date of peak leaf loss (Procedure included). • Observing bud break (greening) (GLOBE procedure URL included). • Weather station data - Tavg. and precipitation (CRONOS – procedure included). • MODIS satellite data for LAI, Evapotranspiration and GPP (procedure included).
Leaf fall & ground truthing • Observations on two species found across the state: red maple and sweetgum
Collection of leaves • Regular collection schedule • for example: Mondays and Thursdays • Standardized collection device
Site selection • Forest stand (not individual trees) • Minimal human activity • Use Google Earth or Google maps and record longitude and latitude
Basket placement: • 4 baskets per tree • 2 at edge of crown • 2 halfway between • trunk and edge of crown
Leaf Litter Data – What to record Date Number of leaves of each species each time data collected Weather conditions since previous collection Other observations (example – basket was removed by groundsmen). SEE SAMPLE DATA
CRONOS – Temperature and Rainfall http://www.nc-climate.ncsu.edu/cronos/
MODIS Satellite data : Leaf Area Index Evapotranspiration Gross Primary Productivity
What are the questions can be address with this activity (lab)? • Is growing season length changing at this site? (MODIS) • Is growing season length different at this site that other locations? If so, why (MODIS) • Do leaf litter data correspond with satellite data? (Leaf litter spreadsheet comparison to MODIS) • What are the water conditions and how might they affect the timing of senescence? (CRONOS & MODIS)
Other Phenology Sources • National Phenology Network • Great Backyard Bird Count • GLOBE Program