Download

1 / 15
150 likes | 307 Views
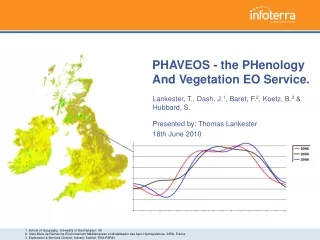
PHAVEOS - the PHenology And Vegetation EO Service. Lankester, T., Dash, J. 1 , Baret, F. 2 , Koetz, B. 3 & Hubbard, S. Presented by: Thomas Lankester 18th June 2010. Objectives.

E N D
PHAVEOS - the PHenology And Vegetation EO Service. Lankester, T., Dash, J.1, Baret, F.2, Koetz, B.3 & Hubbard, S. Presented by: Thomas Lankester 18th June 2010
Objectives • Provide time series of a range of vegetation parameters, utilising the unique spectral, spatial and temporal resolution of the MERIS instrument • Make spatially and temporally continuous time series available through visualisation and download of maps and phenology curves for individual locations • Support the development of a validated baseline time series (2005 - ) in advance of the launch of Sentinels 2 and 3
Level 1b to Level 3 processing approach • Convert MERIS Level 1b data to Level 3 gridded maps, on a daily basis • geometric correction • radiometric correction • atmospheric correction • derive biophysical variable(s) • resample direct to target map grid (latlong, OSGB36, Irish Grid…)
The blue grid represents the input (swath) data grid and the yellow grid the target map grid Level 3 geometric accuracy • To preserve geometric fidelity, resampling into the target map grid is carried out in a single step • To conserve the scene statistics area weighted (flux-conserving) resampling is used
Step 1 apply a cubic spline interpolation of the raw data to generate a continuous time series Level 4 processing - interpolation
Step 2 smooth using a local weighted least squares regression (if no negative noise bias) Level 4 processing - smoothing
3 Level 4 processing – interpolation metrics
Level 3 validation • Moving from Stage 1 to Stage 2(+) validation requires considerable product generation • PHAVEOS is utilising the ESA Grid Processing On-Demand (G-POD) environment • Based on MERIS FRS data from 2005 – present, will deliver a range of Level 3 and Level 4 time series • LAI, fAPAR, fCover, MTCI, NDVI, 2G_RBi, …. • Provision of Level 3 products for MODIS match up sites (N. America) • Coverage of PAR@METER sites • OnLine Interactive Validation Exercise (OLIVE)
Level 4 validation • Land Surface Phenology product validation methods TBD. • issues of spatial disparity where Sentinel 2 could bridge the gap. • Access to Forestry Commission intense monitoring sites (leaf litter collections, phenocams) • Access to UK Phenology Network • Access to tropical (DRC) deforestation ground truth
Phenology metrics – what is the point? • Why use, and validate / inter-compare, basic phenology statistics? • Loss of information from a continuous time series (are we hiding intra-annular information) • Why inter-compare on a handful of measures when full time series are available? • Extraction of metrics is sensitive to interaction of smoothing and metric extraction methods • Different users are interested in different aspects of time series (phenology curves) Are simple metrics capturing a relevant reality?
Phenological beauty is in the eye of the beholder Any questions