A. Hydrologic cycle
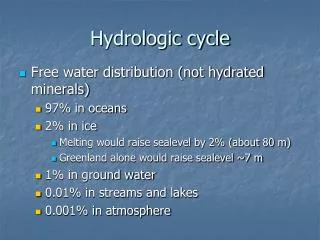
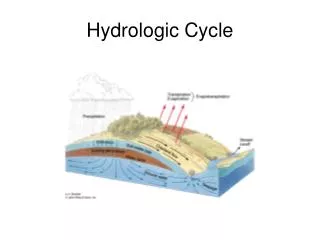
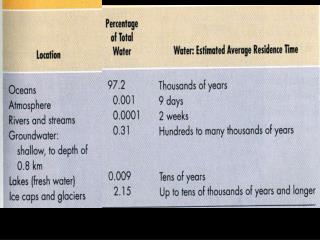
A. Hydrologic cycle. The hydrologic cycle is a summary of the circulation of Earth’s water supply Processes involved in the hydrologic cycle Precipitation Evaporation Infiltration Runoff Transpiration. The hydrologic cycle. Sources of Earth’s water.

A. Hydrologic cycle
E N D
Presentation Transcript
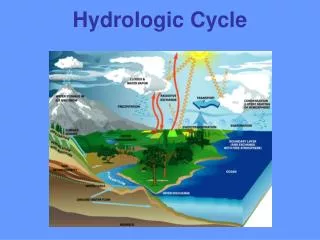
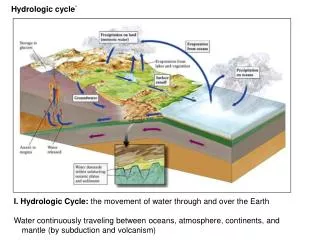
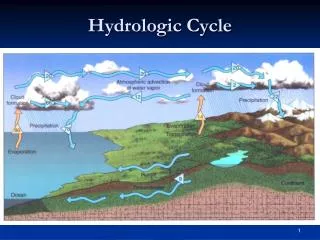
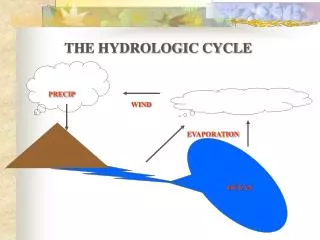
A. Hydrologic cycle • The hydrologic cycle is a summary of the circulation of Earth’s water supply • Processes involved in the hydrologic cycle • Precipitation • Evaporation • Infiltration • Runoff • Transpiration
The Three Fates of Precipitation—Where does rain go? • Evaporation or Transpiration 66% in the US • Infiltration • Runoff – the cause of floods • It is generally of interest to cities to reduce runoff
Civilization exists by geological consent …subject to change without notice. Will Durant
Floods • Floods = any high flow of surface waters that overtops normal confinements or covers land • Floods usually occur when river's channel cannot hold all the water supplied to it by its watershed (the area the river drains).
Flooding from the Feather River extended far off to the horizon in some places. Fig. 12-27, p.313
Floods – • The Worst Geological Hazard • They are the most costly in terms of life, property, and land • They can occur almost anywhere • Damage is caused by: • Erosion by flood waters • Impact of water on structures • Sediment deposition • Contamination of surface waters • Loss of life • 1887 Honan, China 900,000 killed • 1911 Yangtse River 100,000 killed • 1969 Southern California 69 killed
Causes of Floods • High intensity – long duration precipitation • it is greatly worsened by deforestation, farming, and urbanization • examples Duration Depth (inches) Location Date 1 minute 1.23 Unionville, MD 1956 42 minutes 12 Holt, MO 1947 4 hr, 30 min. 30.8 Smethport, PA 1942 24 hrs 45.99 Philippines 1911 2 yrs 1605 Cherraponji, India 1860-61 • Snowmelt • Late spring rapid melting often results in problems down river • Ice Jams • Large blocks of ice clog rivers during spring breakup • Dam Failure • Baldwin Hills Dam 12/14/63 5 killed http://www.stanford.edu/~meehan/la/baldwin.htm • St. Francis Dam 3/12/28 500 killed http://www.rain.org/~stapaula/StFrancisOther.html
Evaluation of Precipitation • Depth or magnitude of the rainfall • Area over which the rain falls • Duration of the rain • Intensity
Shepherdsville, Ohio Ohio River
Floods • Flood account for over 40% of all natural disaster deaths worldwide • WHY? Waterheim, Germany Main River Dahaka, Bangladesh Sea Flood
Davenport, Iowa, also on the Mississippi River floodplain Fig. 12-15, p.304
Why? • More than half the world’s population lives near large bodies of water • Most rivers bursting their banks every two years • Severe weather • Lack of engineering floodplain design • urbanization
D. Recurrence Interval • The average recurrence interval between major storms or floods is easily calculated • a. 10, 100, 1000 year storms for example • Engineers design for particular recurrence intervals • streets 2-5 years • debris dams 5 – 25 years • Upper valley dams 100 years • Levees 100 yrs • Large dams 1000+ years
Flood Frequency • Recurrence Intervals • Analysis
Discharge • Discharge = amount of water flowing past a point in a given unit of time • Units of measure • VOLUME/TIME • gal/min • m3/sec • ft3/sec • How is discharge determined? Cross-sectional area of stream x velocity
Urbanization and its effects on discharge • Less infiltration • More runoff • More flooding • Specific causes: • Deforestation • Construction and paving • Channelization
Rivers do not rise with first rainfall; the thirsty ground absorbs it all. Seneca
Recurrence IntervalsThe average time interval between the occurrence of two flood event • Rivers flood regularly, some at frequent interval • Some flood are large, with very high water level • Small flood are most frequent occurring on the average every 2 or 3 years • Large flood are generally less frequent usually occurring every 10, 20, or 30 years. • There are probabilities not certainties! • There is a 20 % probability that a flood of a given height –say 3 m above bank – will occur in any one year. • This chance corresponds to an average time interval (in this case 5 years (20 %=1 in 5) between two floods 3 m height.
What do you think? Q. What's the probability of a 25 year flooding event occurring each year? A. 1/25= 0.4 *100= 4 % Q.Given that a 25-year flooding event has a probability of 4 % of occurring each year (1/25), what is the probability that a 25-year flood will NOT occur in a given year? A. 100 - 4 = 96 %
What do you think? What's the probability a flood with a recurrence interval of 25 years, during a 10 year period? P(Within 10 years)= 1 - (1 - 1/25)10 = 1 - 0.66 = 0.33 or 33% Q. What's the probability of there being a 50 year type flood in a 20 year period?
Real World Question! • What is the probability of flooding, 50 years flood, within the 30 years that you are paying on the mortgage?
E. Factors which Have Increased Erosion • Deforestation – results in increased erosion • Overgrazing – also increased erosion • Urbanization • More rapid discharge to streams causes: • More frequent floods • Higher flood peaks • Urban runoff is highly toxic
F. Urbanization and Erosion • Both natural and urban landscapes have low erosion rates • Construction as natural lands is urbanized causes high erosion rates
II Formation of Valleys • River Erosion • Rivers cuts their valleys vertically and laterally • Lateral erosion produces broad valleys, flood plains, and meandering streams
Flood Plains • Periodic floods deposit rich soils • Agricultural production on floods plains is followed by urbanization • Natural levees • Forms as floods deposit coarse detritus near the river • Naturally constraint the river except in the larger floods
Inland flooding can be a major threat to communities hundreds of miles from the coast as intense rain falls from these huge tropical air masses.
Reducing Flood Damage • Two Approaches • 1.Water Control • Flood Plain Management • 1. Water Control • Watershed management • Erosion control • Reforestation • 2.Dams and Reservoirs • 30% of US reservoir capacity is devoted to flood control • Small dams are effective in upstream areas • Large dams protect the downstream areas • May also produce hydroelectric power • Dams have enormous negative environmental impacts
Channel clearing and dredging • a.Tends to deepen the channel and increase the capacity • Channel alteration • Cutting off meanders tends to steepen gradients and increase downcutting of the channel • The Mississippi River has been shortened by 100’s of miles • Diversions • Flood waters are diverted into lakes and flood plains • Channel stabilization • Channel banks and floors are paved • 7.Dikes and levees • Very common world-wide to protect fertile flood plains • They increase downstream flood peaks by eliminating flood plain water storage • Failure often results in disaster
Malibu Canyon Dam was built in 1925 in the Santa Monica Mountains Within 13 years the reservoir was filled with sand.(Photo by John. S. Shelton)
Flood mitigation • Flood control structures • dams • flood walls • Channelization • Human try to control flood waters by making channels: 1) clear of debris 2) deeper 3) wider, and 4) straighter. Example LA River • dikes • levees • zoning • prohibition of rebuilding; moving towns • flood insurance
Flood Plain Management • Flood forecasting • Function of the River & Flood Service of the US National Weather Service • Flood Plain Zoning
Case HistoryThe Binational Approach:The issue (s) related to Tijuana river in the US-Mexico border • The two countries agreed on a LA-Style project to cement the river channel but US did not complete the project. • The cement– lined channel project was blocked by environmental activist • The large concrete channel in the city of Tijuana sends high-velocity floods charging into the subdivisions of southernmost San Diego
View southeast from San Diego, CA into Tijuana, Mexico, Jan 1978 Flood waters race through the cement-lined channel in Tijuana (top center of photo) blasting into the farms and subdivisions in southernmost San Diego.
every year the probability (P) of a Maximum Annual Peak Discharge (we'll call this a flood) with a given recurrence interval (RI) is • P = 1 / RI • From that it follows that the probability of there NOT being a flood within one year isP(NOT) =(1 - 1 / RI) • And finally, the probability of there being a certain size flood in X years is P(Within X years) = 1 - P(NOT in X years) = 1 - (1 - 1 / RI)X