

hydrologic cycle
E N D
Presentation Transcript
ESS 454 Hydrogeology Module 1 Course Overview, Hydrogeology History, Hydrologic Cycle, Sustainability I & II
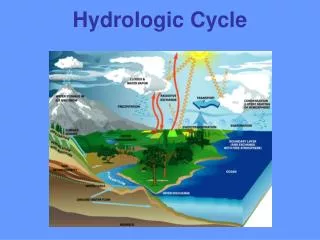
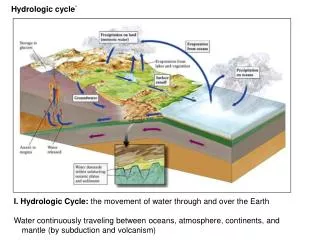
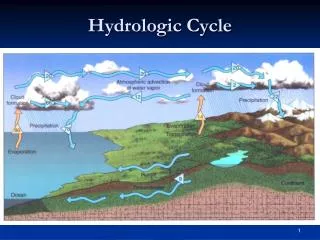
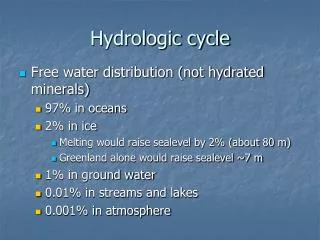
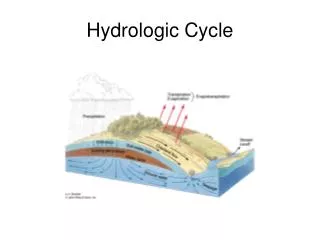
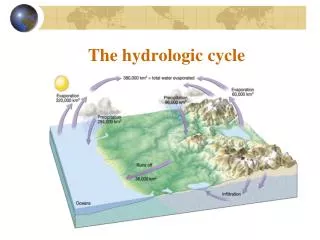
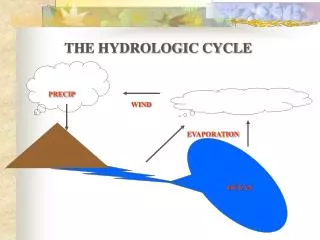
Hydrologic Cycle • Precipitation • Rain • Snow • Evapotranspiration • Direct evaporation • Transpiration • Infiltration • Unsaturated or Vadose Zone • Perched water table • Water Table • Saturated Zone • Capillary fringe • Saltwater wedge Perched Water
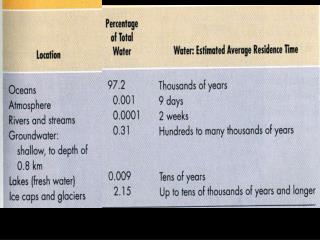
Freeze, R. and J. Cherry, 1979, Groundwater, Prentice Hall, Table 1-2; Nace, R.L., 1971,Scientific framework of world water balance, UNESCO Tech Papers Hydrol, 7, 27 p.
Key Concepts • Precipitation goes to: • Overland flow/runoff • Interflow • Evapotranspiration (direct evaporation and plant exhalations) • Infiltration – what makes it in the ground (10% rule of thumb)
Groundwater includes: • Vadose zone or zone of aeration: • Partially saturated with water • Capillary effects interact with gravity • Capillary Fringe • Zone of saturation above water table where water is drawn up by capillary suction (negative pore pressure) • Water Table • Except for capillary fringe, zone of saturation. Surface where pore pressure is atmospheric • Perched Water Table • Zone of saturation above water table where hydraulic conductivity is less than infiltration and water “ponds”
Recharge • Water entering groundwater system through infiltration or from surface water • Discharge • Water leaving groundwater system usually to surface water or other flow system boundaries • Storage • Water in the the groundwater system
The Hydrologic Equation(Conservation of Mass)(Water Budget) Outflow = Inflow ± Changes in Storage • Applicable to surface features like lakes • Applicable to rivers • Applicable to aquifers • Applicable to basins
The Water Budget:Continental US Average • 30 inches of rain • 22 inches evaporate or transpiration • 8 inches flow to ocean in rivers What about groundwater?? (70x more than SW)
30 inches of precipitation Use “rule of thumb” : 3 inches of infiltation to groundwater Groundwater Outflow = Inflow ± Changes in Storage = 3 inches ± Changes in Storage 8 inches of flow to ocean comes from 5 inches of runoff and 3 inches of discharge from aquifers If Storage is constant, then Outflow is 3 inches
Focus on Details of: • Evaporation and transpiration • Determination of groundwater recharge from streams
Evaporation • Thermodynamics: • Energy input required to move molecules of H2O from liquid to vapor phase (590 cal/gm) • In equilibrium, air has a maximum amount of H2O vapor – the “saturation humidity” • Amount is temperature dependent • T up -> Saturation humidity up • Terms: • absolute humidity • mass of water in volume of air (gm/cc) • relative humidity • ratio of absolute to saturation humidity (dimensionless) • Dew point • temperature at which air is saturated (relative humidity = 100%)
Driving terms for evaporation • Free-water surfaces, Temperature, relative Humidity • Energy • from sun • flux of about 1 KW/m2 at noon • Energy unit Langley: cal/cm2 or 41.8 kJ/m2 500 Ly -> 6 KWH/m2 • Wind • replace saturated air near surface with less saturated air • Disturb water surface to enhance rates of molecular diffusion
Need to Quantify • Even with “accurate” measurement – unlikely that this is better than 10% proposition
Land Pans450 in US • 4 feet by 10” unpainted galvanized metal, on supports with air flow all around • Daily record of how much water added to maintain level • Separate rain gauge to measure precipitation • Measure wind movement in miles/day • Multiply by “pan coefficient” to estimate free water evaporation
Evaporation Calculation using a“Nomograph” • Given: • Mean temperature: 76°F • Insolation: 500 Ly • Mean Dewpoint: 50°F • Wind Movement: 200 mi/day • Calculate: • amount of evaporation from a standing body of water
0.25” of evaporation
Transpiration • Plants pump water into air • Variable with season and time of day • Limited by available soil water (& root depth) • Wilting point • Possible to measure under lab conditions • But not easy in the field.
Evapotranspiration • Combination of two = ET • More amenable to practical study • “Potential” vs “Actual” • “Thornthwaite” method for “Potential ET” • Relies on meterological conditions only • Energy Balance method • solar radiation, energy output from ground, loss of heat to atmosphere, heats of vaporization, etc • Lysimeter • Large container of soil and plants ET • measure inputs to determine
General Trends(relating to local conditions) • ET is the dominant use of water in all but most humid locals • Runoff is larger after logging • less ET • Transition of chaparral to grass in AZ –> less ET, • Grass not as deeply rooted • Transition of sagebrush to grass in CO –> unchanged ET • But more grazing decreased ET • Transition of farm to forest (decreased stream flow -> more ET) • More ET in conifer forest than in deciduous forest • Increased ET in urban areas • less runoff in dry periods • Although more pavement etc, patterns of planting increase ET
Water that does not go to evapotranspiration Interflow (intermediate) Overland Flow (fastest) Groundwater Flow (slowest)
Stream Hydrographs Precipitation Events (Direct, Overland, Interflow) No precipitation, no overland or interflow. OnlyBaseflows Baseflow decreases as aquifer is drained
How to Separate: • Overland flow • Direct precipitation • Interflow • Baseflow
Overland flow duration: D(days)=A(miles2)0.2 1 10 100 1000 miles2= 1 1.6 2.5 4 days • rule of thumb supported by empirical data • not a fundamental theory • Not dimensionally correct
Methods to determine stream discharge • Interesting but will not be on quizzes or tests • Measurement of distribution of precipitation • Homework: Isohyetal lines & Theissen polygons • Estimation of groundwater recharge from baseflow recession
Baseflow 0.5 log units in 50 days t= 100 days = 8.6e6 s
The End: Hydrologic Cycle Coming Up: Southern Nevada Water