Download
1 / 32
330 likes | 790 Views
The World’s 500 Largest Asset Managers. The P&I/Towers Watson global 500 ranking is prepared using joint research by Pensions & Investments and Towers Watson. Year end 2010. Contents. Executive Summary 3 Analysis Section 1: Total value of assets and growth rates 6

E N D
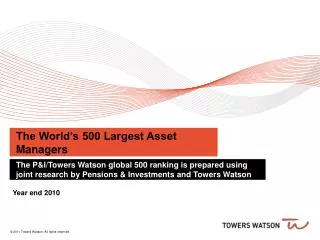
The World’s 500 Largest Asset Managers The P&I/Towers Watson global 500 ranking is prepared using joint research by Pensions & Investments and Towers Watson Year end 2010
Contents Executive Summary3 Analysis Section 1: Total value of assets and growth rates 6 Section 2: Analysis of the largest 20 asset managers 10 Section 3: Passive management 17 Contact details and limitations of reliance 21 Appendix – Complete ranking 22 Page 2
Executive summary Total assets under management of the 500 managers included in the ranking totalled US$ 64.7 trillion at the end of 2010, up 4.4% from the end of 2009. The first three positions in the ranking remained stable, with BlackRock in the first position for the second consecutive year. Assets under management of North American managers were US$ 33.5 trillion at 2010 year end, an increase of 9.7% from the previous year. The assets managed by European managers declined 4.7%, ending on US$ 22.9 trillion for the year. The Top 20 managers’ share of the total assets increased from 40.2% to 40.7%. “AUM increased 4.4% in 2010” “BlackRock remained in the top spot” “AUM of North American managers increased, while European managers’ assets decreased” “Top 20 managers increased their share of total AUM” 4
Executive summary US managers in the Top 20 managed 60.1% of total AuM for that group, while the remaining 39.9% was controlled by European and Japanese managers. By number bank-owned asset managers continued to be the majority of the Top 20 while the number of independent asset managers in that group grew. Insurer-owned asset managers remained static. Assets under management of managers from developing countries remained static in 2010. “US managers dominated the Top 20 group” “Bank-owned managers continued to be the majority of the Top 20 segment” “Assets under management of managers in developing markets remained static” 5
Analysis Section 1: Total value of assets and growth rates 6
Total value of assets managedSplit by manager domicile 69,420 64,711 63,744 61,964 53,629 53,356 48,824 43,334 35,477 35,240 35,179 • Assets under management of the world’s top 500 managers increased by 4.4% in 2010, which nevertheless was still below its 2007 level. • North American managers’ assets increased 9.7% in 2010, while European managers’ assets declined 4.7%. Assets managed by Japanese managers increased 8%. 7
Total value of assets managed Split by segment • The top 20 and the 21-50 segments experienced an increase in 2010. The most significant increase was experienced by the 21-50 managers, who saw their share of top 500 assets increase from 21.5% to 22.5%. 8
Distribution of assets by country10 year overview – 2000 to 2010 Last decade has seen the decline of the representation of managers from Japan and several European markets while managers from Canada, France, Germany, Italy, Spain, US and Other have grown their weights in the global asset management industry. 9
Analysis Section 2: Analysis of the largest 20 asset managers 10
Total value of assets managed by top 20Split by manager domicile • Top 20 managers’ assets for all regions grew in 2010. • In 2010, there were 11 US managers in the top 20 and the remaining managers were European and Japanese. • The US based managers managed 60.1% of top 20 assets at the end of 2010 (62.7% at the end of the previous year). 11
Annual growth of 500 vs. growth of top 20 CAGR of 500 since 2000: 6.3%CAGR of top 20 since 2000: 7.1% 12
Top 20 managers by manager type • At the end of 2010, bank-owned asset managers continued to be the majority in the top 20, followed by independent managers and insurer-owned asset managers. 13
Growth in manager AUM 2005 – 2010The fastest growing firms among the top 50 14
Growth in manager AUM 2005 – 2010The fastest growing firms among the top 50 15
Growth in manager AUM 2005 – 2010The fastest growing firms among the top 50 16
Analysis Section 3: Passive management 17
Annual growth of passive management vs. growth of 500 CAGR of 500 since 2000: 6.3%CAGR of passive since 2000: 13.2% * The 2009 passive growth rate is partially affected by the merger between Barclays Global Investors (BGI) and BlackRock. The passive assets managed by pre-merger BlackRock was not included in the analysis while it formed a part of the analysis after the merger when BlackRock replaced BGI in 2009. 18
Total value of AUM of leading passive managers with annual growth rate CAGR since 2000: 13.2% 9% 62% 16% 22% -25% 10% 24% 38% 4% 3% -2% 19
Value of passive AUM of leading passive managers -At 31 December 2010 20
Contact details and limitations of reliance 21 Contact details Liang Yin Towers Watson Investment +44 1737 284 762 liang.yin@towerswatson.com Jessica Gao Towers Watson Investment +44 207 227 2061 jessica.gao@towerswatson.com In preparing this report at times we have relied upon data supplied to us by third parties. While reasonable care has been taken to gauge the reliability of this data, this report carries no guarantee of accuracy or completeness and Towers Watson cannot be held accountable for the misrepresentation of data by third parties involved. This report is based on information available to Towers Watson at the date of the report and takes no account of subsequent developments after that date. It may not be modified or provided to any other party without Towers Watson’s prior written permission. It may also not be disclosed to any other party without Towers Watson’s prior written permission except as may be required by law. In the absence of our express written agreement to the contrary, Towers Watson accepts no responsibility for any consequences arising from any third party relying on this report or the opinions we have expressed. This report is not intended by Towers Watson to form a basis of any decision by a third party to do or omit to do anything.
Appendix Complete ranking 22