Download
1 / 13
130 likes | 241 Views
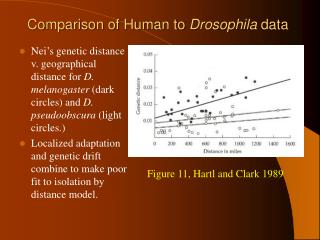
This study compares 2D fields of GENIE data using the singular value decomposition method. Two experiments are conducted, showcasing the efficiency criterion for time series comparison. The research extends to 3D fields, offering applications for automated comparison and detailed analysis of discrepancies.

E N D
Comparison of 2D fields of GENIE data V.Livina, T.Lenton, S.Goswami
Method • Singular value decomposition of 2D matrix M ( ): where & are unitary matrices ( & ), is diagonal matrix of singular values. • Efficiency criterion for time series: Here and are series of singular values (in non-increasing order) • If E=1, two series are identical (point-wise comparison)
Experiment I • GENIE-2, EMBM & C-Goldstein, ‘eb_go_gs’ air temperature over land, 36 x 36 grid • GENIE-1, EMBM & ENTS-land, land temperature, 36 x 36 grid
EMBM temperature over land ENTS land temperature
Singular values and coefficients all SVs: E=0.95 first 10 SVs: E=0.92 first 5 SVs: E=0.85
Experiment II • GENIE-land, ‘ig_fi_fi’, land temperature, 64 x 32 grid (averaged to 32x32) • GENIE-1, EMBM & ENTS-land, land temperature, 36 x 36 grid (cut to 32x32)
GENIE-land, ig_fi_fi land temperature ENTS land temperature
Singular values and coefficients all SVs: E=0.48 first 10 SVs: E=0.26 first 5 SVs: E=-0.08
Comparison of model & real data • If one to compare two model fields, the generalised criterion is applicable • If one to compare model field with the real one, the asymmetric criterion is preferable (real data prioritised)
Generalization to 3D Given 3D field (for instance, (x,y,t) time-evolution of the stream function), one can • apply the method to 2D slices (x,y,i), i=1..N • compile a time series of consequent sets of singular values • then apply the efficiency criterion
Applications • Automated comparison (to check whether E close to 1 without visualisation) • Further detailed analysis of possible discrepancies (which singular values deviate) • Possible generalisations for higher dimensions
Discussion • Introducing weights for singular values? Different distributions have very different sets of singular values! • Ways to compare fields with different grids: truncation, averaging?
![Data Modeling [Comparison of data modeling techniques ]](https://cdn0.slideserve.com/205866/data-modeling-comparison-of-data-modeling-techniques-dt.jpg)


![Data Modeling [Comparison of data modeling techniques ]](https://cdn3.slideserve.com/6795343/data-modeling-comparison-of-data-modeling-techniques-dt.jpg)