Download
1 / 29
310 likes | 550 Views
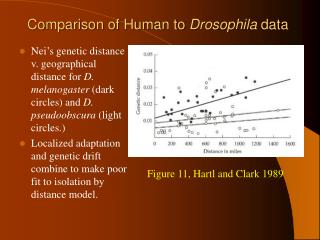
Comparison of Human to Drosophila data. Nei’s genetic distance v. geographical distance for D. melanogaster (dark circles) and D. pseudoobscura (light circles.) Localized adaptation and genetic drift combine to make poor fit to isolation by distance model. Figure 11, Hartl and Clark 1989.

E N D
Comparison of Human to Drosophila data • Nei’s genetic distance v. geographical distance for D. melanogaster (dark circles) and D. pseudoobscura (light circles.) • Localized adaptation and genetic drift combine to make poor fit to isolation by distance model. Figure 11, Hartl and Clark 1989
How much genetic variation exists within humans? Protein electrophoresis by Lewontin and Hubby 1967, show 85% of human genetic variation occurs at the individual level. Nei and Roychoudhury 1982, show that protein variation is greater within the so-called “races” than between them, 93 - 97% within and 7 - 3% between.. Fig. 1, Owens and King, Science 1999 286: 451-453. Brown 1980 examined mitochondrial DNA variation, with same result.
Data from Single nucleotide polymorphisms are consistent with earlier analyses. • SNP’s show 85% variation at the level of the individual, 10% between populations on the same continent, and 5% within local groups. • Small samples in this study suggested that African Americans had more rare SNP’s. This is due to anatomically modern humans orginating in Africa. • SNP haplotypes are also consistent with earlier analyses, suggest recent, rapid expansion of anatomically modern humans from Africa. Fig 1, B. Stephens et al. 2001.
All phenotypic characters together show the fallacy of racial categories. • The physical features used to define America’s social races are discordant with our evolutionary history, Cavalli-Sforza and Edwards 1964, and Montagu 1974. Fig 2.2.3 , Cavalli-Sfroza, Menozzi, and Piazza., 1994
Criteria for race 4 • The failure of phenotypic variation to define races occurs because that variation is discordant. • Discordant variation results from the fact that different portion of the genome are responding to non-correlated selection clines.
Monomorphic loci -- have one allele at a frequency > 99% This true because variants at these loci are highly detrimental to individual fitness. Hemophilia-A mutation, q = 2.0 x 10⁻⁴ The hemophilia-A is a large gene containing 26 exons, 186 kbs. The mutations at this locus include both large and small deletions or insertions. There are 78 large deletions and 223 point mutations are known. Selection and Drift may determine disease frequency
Alleles found in all world populations, 86% Alleles unique to a given continent, 10% Alleles unique to a specific local population, 4% Selection and drift 3 • Thus, it is likely that unrelated families probably carry different hemophilia-A mutants. • Their frequencies are determined by mutation/selection balance. • This means that genetic drift is most likely to determine a population’s frequency.
Selection and Drift 4 • Polymorphic loci have numerous alleles, with no single allele at a frequency > 99%. • Phenylketonuria, q = 0.01 • Tay Sachs A, q = 0.017 • Cystic Fibrosis, q =0.022 • Sickle Cell Anemia, q = 0.050 Distribution of CF D F-508 allele, Fig. 2.14.10, Cavalli-Sforza, Menozzi, and Piazza, 1994.
Polymorphisms in cytochrome enzymes Genetic susceptibility to environmental carcinogens looked at data from 12, 525 Europeans, 2,136 Asians, 936 African Americans, & only 60 Africans, as of December 2001. The small number of Africans means that detecting alleles in this population is difficult.
Pharmocogenomics analysis should not utilize “race”, in place of genetic variation. • Percentages of CYP2C19 poor metabolizer genotypes by population: • Euro-American 2% • Zimbabwe 4% • Korea 12% • Japan 19% • Philippines 23% • Polynesia (outliers) 51% • Southern Vanuatu 74% Kaneko et al (1999) Pharmocogenetics 9: 581. Fig. 5, Evans and Johnson 2001.
Distribution of Sickle Cell Anemia Allele is discordant with “race.” • The origin of the allele is uncertain. • However it is distributed at high frequency in “Negroids and Caucasoids.” • High altitude Kenyans don’t have any sickle cell. • Seen as “Black” disease in U.S. due to importation of slaves derived from W. Africa were malaria was prevalent. Fig. 5.8, Ridley 1996
Genetic variation & hypertension • A number of gene loci have been associated with increased risk of hypertension. • AGT -- which codes for angiotensinogen a protein made by the liver and circulates in excess • ACE – angiotensin converting enzyme Fig. 8, Richard Cooper, et al. 1997
Genetic variation & hypertension II • At the angiotensinogen locus the 235T mutant has tyrosine switched for methionine. • In Euro-Americans, 235T is associated with an increased risk of hypertension. • The 235T allele is found at a frequency of 85% in African Americans. • However, 235T is not associated with increased hypertension risk in Nigerians (.) Cooper, Rotimi, Ward 1999, pg. 42.
Genetic variation & hypertension III • At the ACE locus there is a common alu insertion polymorphism that affects the activity of this enzyme. • The D allele is characterized by an absence of these alu insertions, and thus have higher enzymatic activity. • The available evidence shows that the enzymatic activity of II, ID, and DD genotypes are similar in Nigerians, Jamaicans, and in the United States (all populations.) • Hence the deletion genotypic doesn’t seem to be influenced by “racial” background. • Source: R.S. Cooper (1997).
Hypertension? • Actually, when hypertension rates are stratified by socioeconomic status, the differential is located amongst African Americans in the higher categories. • This is means that the hypertension difference results from a biological response to social/cultural factors (e.g. control racism, reduce hypertension differential.) • Neser et al. 1986; Broman 1989; Calhoun 1992; Light 1995.
Individuals may carry genes of diverse geographic origins • We can now prove by genetic markers that a Jefferson male fathered at least Eston Hemings (7/8 Eu.) • However, Eston Hemings was a slave, identified as “Negro”, by Virginia law. • Beverly Hemings was freed by Jefferson, moved to Philadelphia, and redefined herself, as “white.” Microsoft Encarta, 1999
Jefferson & Hemings • Thus any disease predisposition or resistance gene in the Hemings… • had a 7/8 probability of originating in the European population. • Hence, a 7/8 probability that the disease predisposition would have been misidentified.
Jefferson & Hemings • There is a wide variety of admixture percentages in North Americans with African descent. • Recent measures suggest that the average African Americans has on average 17 - 20% European admixture. • Also there could be as much as 10% American Indian admixture. • Therefore, could be as much as a 30% probability of African American “disease” predisposition originating in Asians and Europeans.
Genetic Distance and Disease Differential • The genetic distances cannot by themselves, explain the differential in disease incidence: • Winkelby 1998, JAMA suggests genetic causes to the 37% greater age- adjusted CVD rates. • However, African Americans and Euro-Americans are only about 5% different in allele frequencies.
Cancer Incidence for American Ethnic Groups, 1996 Source: Miller et al. 1996
Neither single loci or quantitative traits are good candidates to explain the differential. Genetic explanations require the ability to control environments Permissive mutations Environmental effects Mortality differentials can not be explained by genetic distance. • Overall phenotypic variance: • Vp = Vg + Ve + Vgxe + Cov (G,E) + Verror
Gene x environment interaction works against simple racial explanations of disease prevalence • Common gene, common disease hypothesis. • Individuals from any socially defined “race” may have a disease predisposing allele. • This assumes that the environmental influences on the gene’s expression are the same in each group. • However can we assume that safely in the US?
No such equality of environments exists for minorities in America • The physical environments experienced by minorities are not equivalent to those of the majority. • Greater than 53% of the toxic waste sites located within one mile of public housing have > 75% minority occupancy.
Should population categories other than race/ethnicity be used? • I would argue that we probably have never seen genetically based, ‘racial’ differences in most disease categories. • What we have observed are underlying differences in the environments of the socially constructed groups that influence genetic predispositions for disease. • For example, poor communities often have elementary schools located by hazardous waste dumps. • If one “race” has been historically poorer than another, then they would have seen greater exposure.
Socially constructed races face different exposure to carcinogens • In a 2000 study of breast cancer risk in women from NYC: • DDE levels were highest in African American and Hispanics. • DDT highest amongst Hispanics. • HPCB’s highest in African Americans. • Trans-nonachlor highest in African Americans, Wolff, et al. 2000, Environ. Res. 84(2).
Studies of malnutrition in rats showed that maternal effects on adult health extended over several generations. We have already seen that differential stress exposure plays a role in predisposing some African Americans to hypertension. Offspring of alcoholic mothers show FA in their teeth, FA has been linked to lower IQ in college students. Numerous studies show that lasting adult pathology can result from stress in the maternal environment: Desai et al. 1995, Hales et al. 1996, Napoli et al. 1997, Waterland and Garza, 1999. The impact of environmental differences is complex
Conclusion: The most insidious impacts of racism. • African American populations have maintained historical differences in health and mortality. • Biomedical research has focused on innate or genetic explanations. • This has been accomplished without adherence to proper genetic theory or experimental design.
Conclusion: The most insidious impacts of racism 2. • By exposing the genetic fallacies operating in the biological race paradigm the disease mortality differential becomes problematic. • Well intentioned researchers who insist that “special populations” need be included in biomedical research designs need to be wary of the “race” industry.
Conclusion: The most insidious impacts of racism 3. • The remedies we design from the socially constructed theory of race are radically different, then from the biological theory. • The latter, blames the victim for their illness: you are sick because you have bad genes. • The former asks why some individuals are more likely to be exposed to poor diet, stress, & pollution. How does the legacy of racism contribute to differential exposure to sources of disease?
![Data Modeling [Comparison of data modeling techniques ]](https://cdn0.slideserve.com/205866/data-modeling-comparison-of-data-modeling-techniques-dt.jpg)


![Data Modeling [Comparison of data modeling techniques ]](https://cdn3.slideserve.com/6795343/data-modeling-comparison-of-data-modeling-techniques-dt.jpg)