Download
1 / 29
290 likes | 451 Views
Probabilistic Modelling of Brain Imaging Data. Will Penny The Wellcome Department of Imaging Neuroscience, UCL http//:www.fil.ion.ucl.ac.uk/~wpenny. Overview. Multiple levels of Bayesian Inference 2. A model of fMRI time series: The Noise 3. A model of fMRI time series: The Signal.

E N D
Probabilistic Modelling of Brain Imaging Data Will Penny The Wellcome Department of Imaging Neuroscience, UCL http//:www.fil.ion.ucl.ac.uk/~wpenny
Overview • Multiple levels of Bayesian Inference 2. A model of fMRI time series: The Noise 3. A model of fMRI time series: The Signal
First level of Bayesian Inference We have data, y, and some parameters, b First level of Inference: What are the best parameters ? Parameters are of model, M, ….
First and Second Levels The first level again, writing in dependence on M: Second level of Inference: What’s the best model ?
Model Selection We need to compute the Bayesian Evidence: We can’t always compute it exactly, but we can approximate it: Log p(y|M) ~ F(M) Evidence = Accuracy - Complexity
Model Averaging Revisiting the first level: Model-dependent posteriors are weighted according to the posterior probability of each model
Multiple Levels w3 w1 w2 w3 w1 w2 Y Y Evidence Up PosteriorsDown
Overview • Multiple levels of Bayesian Inference 2. A model of fMRI time series: The Noise 3. A model of fMRI time series: The Signal
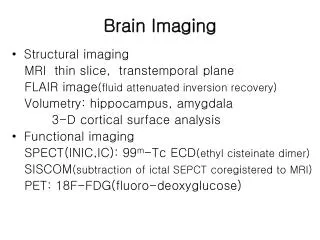
Noise sources in fMRI 1. Slow drifts due to instrumentation instabilities 2. Subject movement 3. Vasomotor oscillation ~ 0.1 Hz 4. Respiratory activity ~ 0.25 Hz 5. Cardiac activity ~ 1 Hz Remove with ICA/PCA – but non-automatic
fMRI time series model • Use a General Linear Model at each voxel: y = X b + e where X contains task-related regressors.
fMRI time series model b e y X + = Time-series at one spatial location Putative effects of experimental manipulation Size of effects Residuals
fMRI time series model • Use a General Linear Model at each voxel: y = X b + e where X contains task-related regressors. • The errors are modelled as an AR(p) process. (Parametric spectral estimation) • The order can be selected using Bayesian evidence
Map of AR model order, p Face Data p=0,1,2,3
Other subjects, a1 Ring of voxels with highly correlated error
Other subjects, a1 Unmodelled signal or increased cardiac artifact due to increased blood flow?
Overview • Multiple levels of Bayesian Inference 2. A model of fMRI time series: The Noise 3. A model of fMRI time series: The Signal
fMRI time series model • Use a General Linear Model y = X b + e • Priors factorise into groups: p(b) = p(b1) p(b2) p(b3) • Priors in each group may be smoothness priors or Gaussians
Rik’s data Every face presented twice Part of larger study looking at factors influencing repetition suppresion Press left key if famous, right key if not 24 Transverse Slices acquired with TR=2s Time series of 351 images
Modelling the Signal Assumption: Neuronal Event Stream is Identical to the Experimental Event Stream Convolve event-stream with basis functions to account for the HRF
FIR models Size of signal Time after event
FIR model Design matrix for FIR model with 8 time bins in a 20-second window Separate smoothness priors for each event type Q. Is this a good prior ?
FIR basis set Left occipital cortex (x=-33, y=-81, z=-24) FIR model average responses
FIR basis set Right fusiform cortex (x=45, y=-60, z=-18) FIR model average responses
RFX-Event model Responses to each event of type A are randomly distributed about some typical “type A” response Design Matrix 97 parameters ! But only 24 effective parameters
Non-stationary models As RFX-event but smoothness priors Testing for smooth temporal variations statistically …
RFX-Event RFX-Event FIR FIR NonStat NonStat Comparing Types of Models Evidence Right Fusiform Left Occipital Model averaging to get peak post-stimulus response
Summary • Bayesian inference provides a framework for model comparison and synthesis • Appropriate for fMRI as we have some prior knowledge • We have focussed on temporal models