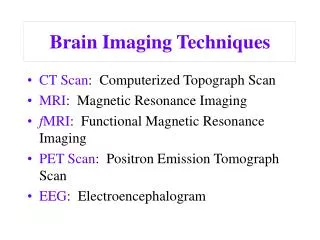
Brain Imaging Techniques
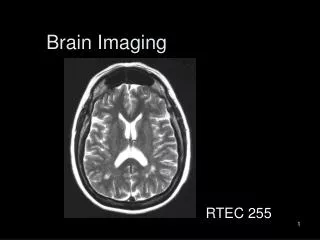
Brain Imaging Techniques. http://www.pbs.org/wnet/brain/scanning/index.html. EEG: Electroencephalograph. What. How. Recording of electrical signals from brain Can show sleep stages How long to process stimuli Can’t show structures and features of brain or which regions do what.


Brain Imaging Techniques
E N D
Presentation Transcript
Brain Imaging Techniques http://www.pbs.org/wnet/brain/scanning/index.html
EEG: Electroencephalograph What How • Recording of electrical signals from brain • Can show sleep stages • How long to process stimuli • Can’t show structures and features of brain or which regions do what • Made by hooking up electrodes to the subject's scalp. • Impulses are sent to instruments that detect and measure small electric currents that in turn are hooked up to pens that trace the signals onto graph paper.
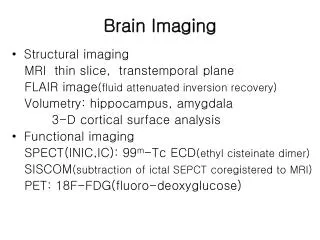
CAT: Computerized Axial Tomography What How • Combines 2-D X-rays to generate cross sections or 3-D images of internal organs and body structures • Donut-shaped x-ray machine that moves around a person
PET: Positron Emission Tomography What How • Observe blood flow or metabolism in any part of brain • Imaging software allows us to look at cross-sectional “slices” • Observe DEEP brain structures • Injected with a small amount of radioistope (glucose usually for brain) • If cells are more active, they consume more glucose • Produce a color coded brain map
MRI: Magnetic Resonance Imaging What How • Produce very clear and detailed pictures of brain structures. • Often, the images take the form of cross-sectional "slices" which are obtained through the use of "gradient magnets" to alter the main magnetic field in a very specific area while the magnetic force is being applied. • Moveable bed inserted into giant circular magnet • The MRI machine's magnetic field actually realigns the body's hydrogen atoms (or, in this case, the atoms in the head). • Unlike PET, MRI does not require the subject to be injected with a tracer substance.
MEG: Magnetencephalography What How • Measures very faint magnetic fields that emanate from head as result of brain activity • Most accurate resolution of timing of nerve cell activity—down to milliseconds! • Magnetic detection coils bathed in liquid helium poised over subject’s head • SQUID (superconducting quantum interface device) • -269 degrees Celsius • $millions, weighs 8 tons, very few worldwide
MEG In the recordings and images here, the subject has been stimulated with a pneumatic pulse which lightly applies rapid pressure pulses to the finger. The first picture is a recording with time from the 148 different sensors within the MEG scanner. The large pulses in the centre show the point in time where the stimulation to the finger was applied. MEG field map produced from the MEG recording above. The sensors are layed out evenly on a helmet which encloses the top back and sides of the head and each one is numbered 1-148. The numbers on the map show where each sensor location is on the map. The different colours represent different strength and direction of magnetic field in the brain. The sensor array is in three dimensions to surround the head, but the map is shown flattened out into one plane on the left.
MEG The MEG scanner is not capable of making anatomical images in the same way that an MRI scanner can, it can only show the magnetic field generated in the brain in 3 dimensions. In order to obtain a reference to where the magnetic activity is occuring in the brain, the MEG field map is overlayed onto a 3 dimensional MRI data set as shown below. http://www.liv.ac.uk/mariarc/megimage.htm