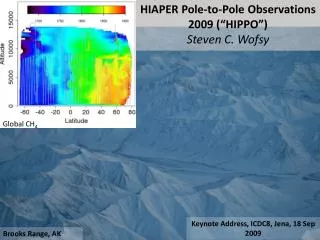
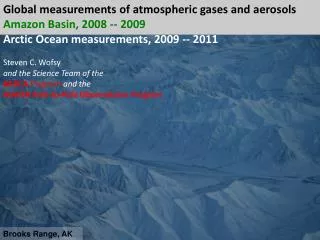
Brooks Range, AK
Global measurements of atmospheric gases and aerosols Amazon Basin, 2008 -- 2009 Arctic Ocean measurements, 2009 -- 2011 Steven C. Wofsy and the Science Team of the BARCA Program and the HIAPER Pole-to-Pole Observations Program. Brooks Range, AK.

Brooks Range, AK
E N D
Presentation Transcript
Global measurements of atmospheric gases and aerosols Amazon Basin, 2008 -- 2009 Arctic Ocean measurements, 2009 -- 2011 Steven C. Wofsy andthe Science Team of the BARCA Program and the HIAPER Pole-to-Pole Observations Program Brooks Range, AK
Global environmental changes—in the “natural” environment and the built environment—represent some of the most powerful forces that give rise to “extreme” or “sudden” events. This lecture discusses changes in the chemical composition of the atmosphere – what we know about the past, and the present changes that are unfolding.
The temperature of the earth has increased by 0.8 C since 1920 http://data.giss.nasa.gov/gistemp/graphs/
Paleoclimate data from Antarctic Ice Cores The heavier temperature lines from 160,000 BP to present reflect more data points for this time period, not necessarily greater temperature variability. Climate and Atmospheric History of the past 420,000 years from the Vostok Ice Core, Antarctica, by Petit J.R., Jouzel J., Raynaud D., Barkov N.I., Barnola J.M., Basile I., Bender M., Chappellaz J., Davis J. Delaygue G., Delmotte M. Kotlyakov V.M., Legrand M., Lipenkov V.M., Lorius C., Pépin L., Ritz C., Saltzman E., Stievenard M., Nature, 3 June 1999.
Changes in atmospheric composition: “Greenhouse gases”, CO2 CO2 change from the present, ppm Time from present 1000’s of years
Atmospheric methane Atmospheric Methane Concentration (parts per billion) 500 1000 1500 Atmospheric Methane Concentration 500 1000 1500 -150,000 -100,000 -50,000 0 -4000 -3000 -2000 -1000 0 Time before present (Years) Time before present (Years)
Insert a news item showing that increasing numbers of the public think "Climate Change" is a hoax, or too uncertain to inform policy, etc.
Some questions about the global environment: • Q1. How quickly is the earth warming, and what are the consequences ? (Not required to ask, and answer this question: perfect knowledge of how much warming might be attributed to human activities.) • Q2. Is aridity (dryness; Precipitation – Evaporation) increasing in vulnerable places? • Q3. What climate changes are ongoing in the Arctic; what is the response of sea level, and of “greenhouse” gases (CO2, CH4)? • Examples of recent studies of the Arctic environment
Changes in Sea Level are linked to climate through the temperature of the ocean and the stranded ice on the continents
Rate of Ice volume change: All Greenland: -238 km3/yr South Greenland: -164 North Greenland: -65 73.250 N -238 km3/yr = 0.5 mm/yr sea level rise
1. Arctic 1979 The Arctic Ocean has been covered by floating ice for all human history… …until 2007 What do these changes mean for climate, forests, crops?
HIPPO platform: NCAR Gulfstream V "HIAPER" GV launch in the rain, Anchorage, January, 2009 (HIPPO-1)
Flight Plan across the arctic ocean 60N to 82N, August 2011 41+ kft 28 kft
August, 2011 Photos: S. Wofsy
UT NN GGLAT GGLON ALT m To C 74640 1473 75.17651 -161.4241 257.740 -3.14 UT NN GGLAT GGLON ALT m To C 74520 1467 75.04469 -161.5916 653.708 -4.736278 Photos from 19 Aug 2011 UT NN GGLAT GGLON ALT m To C 74580 1469 75.11114 -161.5076 403.508 -3.894623 UT NN GGLAT GGLON ALT m To C 77280 1481 78.70973 -156.4544 3854.904 -25.08
Photos: S. Wofsy Mist rising from very warm water 200km in the ocean
GLOBAL METHANE SOURCES, Tg a-1 [IPCC, 2007] Sink: oxidation by OH (lifetime of 10 years) BIOMASS BURNING 10-90 ANIMALS 80-90 WETLANDS 100-230 LANDFILLS 40-70 GAS 50-70 TERMITES 20-30 COAL 30-50 RICE 30-110
HIPPO CH4 Methane is being produced in the surface waters of the Arctic Ocean, especially where the ice pack has broken up, and we see this new emission in the atmosphere.
Relationships between tracers with distinct sources: A tool for understanding large scale sources and sinks of GHGs. Slide from: E. A. Kort
82N 15 April 2010 CH4:CO2 = .0085 CH4 1880 1890 1900 78N 02 Nov. 2009 CO2 385 386 387 ppm
Photos: by; B. C. Daube & J. V. Pittman
Summary: The Arctic • The data show: • Dense pollution at both very high altitudes, and at low levels, in the Arctic. • Sources of CH4 in the Arctic from from the ocean surface, significant compared to fossil fuel extraction and land surface. • Extensive loss of floating ice in the Arctic Ocean, and melting of glacial ice on Greenland. • … and a lot more
Summary: Environmental Science and Engineering, Global Change element • What people in this field are doing: • Making measurements in the atmosphere, in the sea, on land, and in the ecosystems of land an sea. • Creating databases that can be accessed widely, and constructing models to simulate natural systems. • Analyzing and modeling these observations to address questions important to science, and to society. • … and a lot more