Download
1 / 27
270 likes | 474 Views
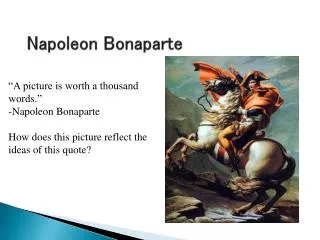
Graphic Representations: A Picture Clarifies a Thousand Words. Karen Brunner & Kristi Roberson-Scott. Is a picture worth a thousand words?. Graphic organizers form powerful visual pictures of information and allow one to “see” undiscovered patterns and/or relationships.

E N D
Graphic Representations: A Picture Clarifies a Thousand Words Karen Brunner & Kristi Roberson-Scott
Is a picture worth a thousand words? • Graphic organizers form powerful visual pictures of information and allow one to “see” undiscovered patterns and/or relationships. • Between 80% and 90% of information we receive from our environments is visual. • Our brains process 36,000 images every hour. • Our brains likes to “chunk information- graphic organizers complement the way the brain naturally works. • Memory for visual images- • In one study, subjects shown 10,000 pictures were then later shown the same images again mixed with new ones. The subjects identified the previous pictures with 90% accuracy.
What are graphic organizers? • Pictorial or graphical ways to organize information and thoughts for understanding, remembering or for writing • A way to organize newly acquired and existing concepts into a hierarchical network and depict relationships • Visual illustrations of verbal statements • Graphic forms with corresponding text frames • “A good graphic representation can show at a glance the key parts of a whole and their relations, thereby allowing a holistic understanding that words alone cannot convey” (Jones, Pierce & Hunter, 1988)
What are the potential benefits of using a graphic representation? • Valuable instructional/teaching tool to help: • Construct meaning/Increase understanding, recall, & higher-order thinking • Determine what is important • How key concepts/ideas relate • What points are unclear • Create interest and help motivate • Organize thoughts/concepts for writing and/or difficult content • Can facilitate meaningful student learning • Accommodates different learning styles • Encourages active classroom discussion
Why Graphic Representations Can Help Our Students • 64% of students taking the Learning Styles Assessment at Freshman Experience identified as visual learners; less than 6% identified as textual learners.
Why Graphic Representations Can Help Our Students • When asked “what types of things help you learn best in your classes?” many students gave responses such as: • “I am a visual learner so anything I can see helps me.” • “It is easier for me to learn when a teacher uses visual learning strategies.” • “Graphs, pictures, demonstrations” • “Visual aids, reference, and projects”
Why Graphic Representations Can Help Our Students • When asked “my students learn the most when they…” a number of faculty said: • “See pictures” • “Read actively” • “Use critical thinking methods when reading” • “Do well-organized, step-by-step activities” • “Do activities that present a challenge but not so challenging that they can’t complete the task.”
How do you connect students to content? • Do you think there is a disconnect between students & content? Neural networking? • When you ask your students to translate complex and holistic patterns into linear thinking what happens? • Mind mapping or creating graphic representation of content can offer an intermediary step between the web of information in the brain and expository representation of that information. • Our brains make sense of information by discerning patterns… learning occurs when students perceive and construct patterns.
Graphic Organizers • Help with the following academic tasks: • Describe • Compare/Contrast • Classify • Make decisions • Sequence events • Understand hierarchical relationships
Types of Graphic Organizers • Concept maps • Web or spider maps • Fishbone Maps • Network trees • Matrices • Flow Charts
Types of Representations Major types of representations: • Hierarchy – shows levels and groups • Sequencing- shows steps, events, stages or phases • Matrices – shows comparative relationships – topics, repeatable categories and details • Diagrams – displays or illustrates the parts/components of different objects
Constructing Graphic Representations • Structure of graphic should reflect the structure of the material/text it represents. • Steps: (See QEP Handout) • 1) Discuss graphic representations (can be used as a reading strategy) with students. • 2) Explain why and how the strategy could be useful to students. • 3) Model the strategy. • 4) Select a reading passage (could be a subsection of the textbook).
Constructing Graphic Representations • 5) Instructor completes a graphic representation. • 6) Ask students to read the passage/text. • 7) Ask students to survey the text title(s), subheadings, illustrations, captions, abstract (if available or pertinent), and objectives. • 8) Provide a blank graphic representation that you, as the instructor, prepared. Discuss why you selected that type. • 9) Questioning: Concepts- hierarchy, timeline, compare/contrast, explanation of something, apparent signal words
Constructing Graphic Representations • 10) Complete the graphic representation with the students. Explain why you selected the information you did. • 11) Assign a passage and ask students to complete a blank representation form that follows the same organizational structure that you modeled. • 12) Group work/individual assignment • 13) Provide a copy of your graphic representation. • 14) Provide feedback to students. (QEP Rubric Handout) • 15) Should be a required assignment with credit. Learners, with practice in using graphic representations, will be able to construct a mental model of his/her fundamental knowledge of the material (what is important and how ideas/concepts are related).
Graphic Organizer: Spider Map • Resembles spider web, with the main idea at the center of the web and all other ideas flow out from the center to create the threads. • Used to describe a central idea: a thing (geographic region), process (mitosis), concept (stroke volume & exercise), or proposition. • Key frame questions: What is the central idea? What are the attributes? What are the functions?
Spider Maps • Resembles a spider web, with the main idea as the center of the web and other ideas flow from the center to create the threads. • Graphic representation to describe: • Thing • Process • Concept • Proposition
Spider Map • Possible applications: • Helpful in reading for understanding and writing papers (using it to generate ideas) • Describing a thing (geographic region), process (meiosis), concepts, propositions with support (experimental drugs for cancer patients), etc.
Fishbone Maps • Interaction of a complex event (war, election, nuclear explosion), phenomenon (learning disabilities). This graphic representation is like the spider map but can be used for complex topics with more details.
Fishbone Map Continued • What are the factors that cause X? • How are these interrelated? • Are the factors that cause X the same as those that cause X to persist?
Sequential graphic organizers: Continuum or Chain of Event Maps • Types: Timelines (temporal order), flowcharts (discrete steps completed in order), cyclical organizer (connected steps with last step connected to first), hierarchy • How events or consequences flow in sequence or a continuum. • Progression of time • Steps of a process
Flowchart Timeline Continuum or Chain of Event Maps
Examples (See Handouts) • Case Study • Sample Cause & Effect Chain • Compare/Contrast Matrix