Download
1 / 48
480 likes | 595 Views
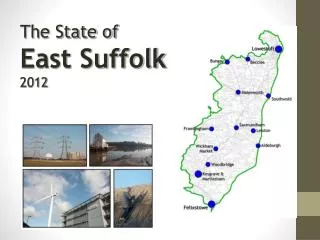
North East education - The State of the Region. North East education… not quite the big picture. Second smallest, least populous with lowest GDP per capita of any region. Context.

E N D
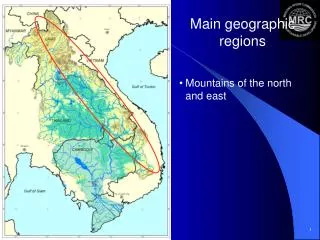
Second smallest, least populous with lowest GDP per capita of any region
Context 15 per cent of adults aged 16 to 64 had disabilities that limited their daily activities or work - the highest region in England.More than a fifth of children in the North East lived in workless households - the highest proportion in the UK.Life expectancy at birth in the region is among the lowest in the UK.Gross disposable household income (GDHI) in 2010, was 15 per cent below the UK average + the lowest of the English regions and countries of the UK.
FSM Nursery & Primary = 24.4% National average 19.2%Secondary = 19.5%National average 15.9%
Special needs Lower levels of pupils with statementsPrimary = 1% compared to 1.4% nationally & 1.7% East of EnglandSecondary = 1.9% compared to 2% nationally & 2.4% East of England
Special needs Higher levels of pupils without statementsPrimary = 18.1% compared to 17.1% nationally & 15.6% East MidlandsSecondary = 18.6% compared to 18.3% nationally & 16.8% East of England
Special needs Highest % of pupils in maintained special schools = 1.6%1.2% nationally
Class sizes Smallest class sizes at Primary and Secondary
Pupil/teacher ratio Lowest pupil to teacher ratio in Primary = 20.8Second lowest secondary = 15.2
Funding Second highest pupil funding – real terms (3-19) = £5140Same as national average as London = £6110
Academies 21 Sponsor-led (501 England)74 Converter (1808 England)As of 1 September 2012
Early years Highest gap between the lowest achieving 20% in the Early Years Foundation Stage Profile and the rest = 33%31.4% national average & South East 28.8%
Outcomes Percentage of pupils achieving at least a level 4 in English and Maths - higher than the national averagePercentage of pupils achieving level 4 or above – at national average for English overall and Reading; below for Writing; and slightlyabove for Maths
Outcomes Improvements year on year esp. at A level but still lagging on some key indicators
Outcomes Highest % achieving 5 GCSEs A-C dropping to second lowest when you include English and Maths
Mind the gap Big variation between the highest performing and lowest performing even when context is taken into account
The North East of England remains the region with the lowest national level of participation in higher education
Which of these is Gove’s best look? • Picture 1 • Picture 2 • Picture 3 0% 0% 0% 5
About you: type of school • Primary • Nursery • First • Middle • Secondary • High • All-through • Special 5
About you: type of school • Community School • Foundation School • Converter Academy • Sponsored Academy • Trust School • Independent School • Non-maintained • Other 5
About you: how long have you been in a school leadership position ? • Less than 1 year • 1-3 years • 4-8 years • 9-15 years • 15 years + • N/A 5
How old are you? • Younger than 35 • 36-45 • 46-55 • 56-60 • 60-65 • 66+ 5
Reforms: Rank these changes in order of the impact on your school in the next year.(top 3 choices only) (Your highest impact should be your first press) • Academies programme • Free Schools • Testing/exam reforms • Ofsted changes • Pupil premium • Funding changes • Changes to the LA • Curriculum changes 5
Collaboration: what is your most important relationship • Other local school/s of same phase • Feeder school • Local Authority • Academy sponsor/chain • Teaching School • Trust partners • Business/other organisation • Other 5
Collaboration: what do you think will be your most important relationship in 2 years time? • Other local school/s of same phase • Feeder school • Local Authority • Academy sponsor/chain • Teaching School • Trust partners • Business/other organisation • Other 5
Funding: By how much has your budget changed compared to last year? • Over 15% decrease • 11-15% decrease • 6-10% decrease • 1-5% decrease • Same as last year • 1-5% increase • 6-10% increase • 11-15% increase • Over 15% increase 5
Ofsted: Do you think the changes to Ofsted are: • Generally good • Generally bad • Too early to tell • Just don’t know 5
Teaching: do you think the status of teaching has.. • Gone up over the last 5 years • Gone down over the last 5 years • No change 5
Teaching: Is QTS necessary to be a good teacher? • Yes • No • Not sure 5
Social mobility: Over the last 10 years do you think social mobility in your community has? • Improved • Declined • Stayed the same • Not sure 5
Social mobility: Over the last 2 years do you think social mobility in your community has? • Improved • Declined • Stayed the same • Not sure 5
Social mobility: Do you think Universities should give lower entry offers to disadvantaged students? • Yes • No • Not sure 5
On a scale of 1-9 how confident are you in the current examination system? (9 = totally confident) • Choice One • Choice Two • Choice Three • Choice Four • Choice Five • Choice Six • Choice Seven • Choice Eight • Choice Nine 5
Testing: Do you support the idea of a single examination board? • Yes • No • Not sure 5
Testing: Do you think the introduction of the English Bacc Certificate is… • A good move • A bad move • Need more information 5
Testing: Do you think the Year One Phonics test is… • A good move • A bad move • Too early to say 5
Curriculum: Do we need a national curriculum? • Yes • No • Not sure 5
Curriculum: Do you support the idea of a TechBacc? • Yes • No • Need more details 5
Autonomy: since last year, do you feel that you have? • More freedom to innovate • Less freedom to innovate • No change • Not sure 5
Accountability: since last year, do you feel you are subject to? • Increased accountability • Decreased accountability • Same weight of accountability • Not sure 5
Economy: is the current economic situation having… • No effect on my school community • A small effect on my school community • A large effect on my school community 5
Support – where will you source school improvement support in the future? • Teaching School alliance • Other local schools • Local Authority school improvement team • Commercial provider • Charitable or not for profit • Academy sponsor/chain • Network/membership organisation • Other 5
Support: have the services your LA offers changed in the last year? • Yes, a lot • Yes, a little • No • Not sure 5
School readiness – do you feel children are… • Less ready for school than 10 years ago • More ready for school than 10 years ago • No change 5
Work readiness – do you feel young people are… • More ready for work than 10 years ago • Less ready for work than 10 years ago • No change 5
State of mind – which of the following best describes your state of mind? • Confused • Motivated • Tired • Challenged • Angry • Empowered • Determined • Fearful • Optimistic 5
Do you need a cup of coffee? • Yes • No • Not sure 5