Progress Towards Universal Primary Education in Mangaung Metropolitan Municipality
This study analyzes the achievement of Millennium Development Goal 2 (MDG 2) in the Mangaung Metropolitan Municipality, focusing on net enrollment rates in primary education from the 2001 and 2011 censuses. The findings indicate a stable enrollment rate of approximately 95%, yet highlight a concerning trend of declining female enrollment, with girls' participation decreasing relative to boys. The study provides insights into gender disparities in education and underscores the ongoing challenges in quality and retention. Recommendations for addressing these issues are discussed.

Progress Towards Universal Primary Education in Mangaung Metropolitan Municipality
E N D
Presentation Transcript
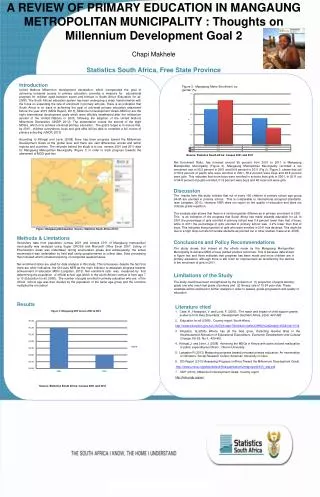
A REVIEW OF PRIMARY EDUCATION IN MANGAUNG METROPOLITAN MUNICIPALITY : Thoughts on Millennium Development Goal 2 Chapi Makhele Statistics South Africa, Free State Province Introduction United Nations Millennium development declaration, which incorporated the goal of achieving universal access to primary education, provides a measure for educational progress for children aged between seven and thirteen in South Africa (Education for all, 2008). The South African education system has been undergoing a major transformation with the focus on expanding the rate of enrolment in primary schools. There is an indication that South Africa is on track of achieving the goal of universal primary education attainment before the year 2015 (MDG Report, 2013). Millennium Development Goals (MDG’s) are the eight international development goals which were officially established after the millennium summit of the United Nations in 2000, following the adoption of the United Nations Millennium Declaration (UNDP, 2013). The presentation covers the second of the eight MDG’s, which is to achieve universal primary education. The goal’s target is to ensure that, by 2015 , children everywhere, boys and girls alike will be able to complete a full course of primary schooling (UNDP, 2013) According to Kiringai and Levin (2008) there has been progress toward the Millennium Development Goals at the global level and there are vast differences across and within regions and countries. The rationale behind the study is to use census 2001 and 2011 data for Mangaung Metropolitan Municipality (Figure 1) in order to track progress towards the attainment of MDG goal two. Figure 3: Enrollment by gender (%) Figure 3: Mangaung Metro Enrollment by gender (%) Net Enrolment Ratio, has hovered around 95 percent from 2001 to 2011 in Mangaung Metropolitan Municipality (Figure 2). Mangaung Metropolitan Municipality recorded a net enrolment rate of 95.2 percent in 2001 and 94.8 percent in 2011 (Fig 2). Figure 3 shows that out of 95.2 percent of pupils who were enrolled in 2001, 50.2 percent were boys and 49.8 percent were girls. This indicates that more boys were enrolled in schools than girls in 2001. In 2011 out of 94.8 percent of pupils enrolled, 51.6 percent were boys and 48.4 percent were girls. Discussion The results from this study indicate that out of every 100 children of primary school age group 94-95 are enrolled in primary school. This is comparable to international accepted standards. (see Langsten, 2013). However NER does not report on the quality of education and does not indicate grade repetition. The analysis also shows that there is a minimal gender differences in primary enrolment in 2001. This is an indication of the progress that South Africa has made towards education for all. In 2001 the percentage of girls enrolled in primary school was 0.4 percent lower than that of boys, while in 2011 the percentage of girls enrolled in primary school was 3.2% lower than that of boys. This indicates that proportion of girls who were enrolled in 2011 has declined. This might be due to a high drop out rate for female students as pointed out in other studies (Case et al. 2005). Source: Statistics South Africa: Census 2001 and 2011 Source: Statistics South Africa: Census 2001 and 2011 Net Enrolment Ratio, has hovered around 95 percent from 2001 to 2011 in Mangaung Metropolitan Municipality (Figure 2). This study reveals that Mangaung Metropolitan Municipality recorded a net enrolment rate of 95.2 percent in 2001 and 94.8 percent in 2011 (Fig 2). Figure 3 shows that out of 95.2 percent of pupils who were enrolled in 2001, 50.2 percent were boys and 49.8 percent were girls. This indicates that more boys were enrolled in schools than girls in 2001. In 2011 out of 94.8 percent of pupils enrolled, 50.7 percent were boys and 49.3 percent were girls. The study shows that the proportion of girls who were enrolled in 2001 has declined in 2011. Discussions The results from this study indicate that out of every 100 children of primary school age group 94-95 are enrolled in school. This is comparable to international accepted standards. (see Langsten, 2013). However NER does not report on the quality of education and does not indicate grade repetition. NOW DISCUSS THE GENDER DIFFERENTIALS AND ALSO CONCLUDE ON THEM BELOW Figure: Mangaung Metropolitan. Source: Statistics South Africa(2013) Methods & Limitations Secondary data from population census 2001 and census 2011 of Mangaung metropolitan municipality was analyzed using Super CROSS and Microsoft Office Excel 2007. Listing of Enumeration areas was undertaken during enumeration phase and subsequently, the actual enumeration was undertaken by field staff using questionnaires to collect data. Data processing then followed which included scanning of completed questionnaires. Net enrolment ratios are used for data analysis in this study. This is because, despite the fact that there are other indicators, the UN uses NER as the main indicator to assesses progress towards achievement of education MDG (Langsten, 2013). Net enrolment ratio was measured by first determining the population of official school age which in the south African context is from age 7 to 13 (Education for all, 2008). The number of pupils enrolled in primary education who are of the official school age was then divided by the population of the same age group and the outcome multiplied by a hundred. Conclusions and Policy Recommendations The study shows that indeed all the efforts made by the Mangaung Metropolitan Municipality to achieve MDG 2 have yielded positive outcomes. This is because data shown in figure two and three indicates that progress has been made and more children are in primary education, although there is still room for improvement as recorded by the decline in the enrolment of girls in 2011. Conclusions and Policy Recommendations The study indicates that there has been a 0.4% enrolment decline between 2001 and 2011. This is an indication that if the status quo is maintained, mangaung metropolitan municipality will not be able to ensure that all boys and girls complete a full course of primary education by 2015. Progress will be needed if Mangaung Metropolitan Municipality is to achieve the target of 100% by 2015. Limitations of the Study The study could have been strengthened by the inclusion of (1) proportion of pupils starting grade one who reach last grade of primary and (2) literacy rate of 15-24 year olds. These variables will be explored in further analysis in order to assess grade progression and quality of education. Literature cited Education for all (2008) . Country report: South Africa http://www.education.gov.za/LinkClick.aspx?fileticket=rJwNOU9f82I%3d&tabid=452&mid=1034 Kiringai,J. and Levin, J (2008) Achieving the MDGs in Kenya with some aid and reallocation of public expenditures.Obrero : Obrero University. Langsten R (2013) Measuring progress toward universal primary education: An examination of indicators. Social Research Center: American University in Cairo. MDG Report (2013) Assessing Progress in Africa Toward the Millennium Development Goals. http://www.uneca.org/sites/default/files/publications/mdgreport2013_eng.pdf UNDP (2013), Millennium Development Goals: Country report http://hdr.undp.org/en/ Results Literature cited Case, A., Hosegood, V. and Lund, F. (2005). ‘The reach and impact of child support grants: evidence from Kwa Zulu-Natal.’ Development Southern Africa, 22(4): 467-482. Education for all (2008) . Country report: South Africa http://www.education.gov.za/LinkClick.aspx?fileticket=rJwNOU9f82I%3d&tabid=452&mid=1034 3. Kingdom, G.(2005) Where has all the bias gone. Detecting Gender Bias in the Intrahousehold Allocation of Educational Expenditure. Economic Development and Cultural Change. Vol 53. No 3.: 409-451. 4. Kiringai,J. and Levin, J (2008) Achieving the MDGs in Kenya with some aid and reallocation of public expenditures.Obrero : Obrero University. 5. Langsten R (2013) Measuring progress toward universal primary education: An examination of indicators. Social Research Center: American University in Cairo. 6. DG Report (2013) Assessing Progress in Africa Toward the Millennium Development Goals. http://www.uneca.org/sites/default/files/publications/mdgreport2013_eng.pdf 7. UDP (2013), Millennium Development Goals: Country report http://hdr.undp.org/en/ Acknowledgments MrTshepangChueu for data analysis MrsMananaKgabanyane for data analysis Mr Karl Heinz Joubert for mapping Mr Thabo Letsoalo for guidance MrsNtebogengMadlopha for data analysis Source: Statistics South Africa: Census 2001 and 2011