Download
1 / 69
840 likes | 1.82k Views
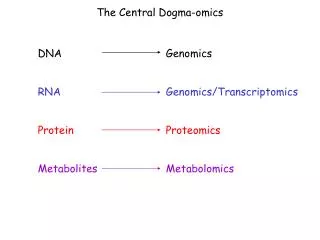
NMR & Metabolomics The Possibilities & The Limitations. David Wishart Depts. Comp. Sci and Bio. Sci. University of Alberta & NINT david.wishart@ualberta.ca. The (Human) Pyramid of Life. Metabolomics Proteomics Genomics. 1400 Chemicals. 3000 Enzymes. 30,000 Genes.

E N D
NMR & MetabolomicsThe Possibilities & The Limitations David Wishart Depts. Comp. Sci and Bio. Sci. University of Alberta & NINT david.wishart@ualberta.ca
The (Human) Pyramid of Life Metabolomics Proteomics Genomics 1400 Chemicals 3000 Enzymes 30,000 Genes
The (Bacterial) Pyramid of Life Metabolomics Proteomics Genomics 761 Chemicals 1152 Enzymes 4269 Genes
Why Measure Metabolites? Metabolites are the Canaries of the Genome
Metabonomics & Metabolomics • Metabonomics:The quantitative measurement of the time-related “total” metabolic response of vertebrates to pathophysiological (nutritional, xenobiotic or toxic) stimuli • Metabolomics:The quantitative measurement of invertebrate metabolic profiles to characterize their phenotype or phenotypic response to genetic or nutritional perturbations MetaboXomics
Metabolomics Allows One to.. • Generate metabolic “signatures” • Monitor/measure metabolite flux • Monitor enzyme/pathway kinetics • Assess/identify phenotypes • Monitor gene/environment interactions • Track effects from toxins/perturbants • Monitor consequences from gene KOs • Identify functions of unknown genes
Traditional Metabolite Analysis HPLC, GC, CE, MS
Problems with Traditional Methods • Requires separation followed by identification (coupled methodology) • Requires optimization of separation conditions each time • Often requires multiple separations • Slow (up to 72 hours per sample) • Manually intensive (constant supervision, high skill, tedious)
Advantages • Measure multiple (10’s to 100’s) of metabolites at once – no separation!! • Allows metabolic profiles or “fingerprints” to be generated • Mostly automated, relatively little sample preparation or derivitization • Can be quantitative (esp. NMR) • Analysis & results in < 60 s
Why NMR? Mixture separation by HPLC (followed by ID via Mass Spec) Mixture separation by NMR (simultaneous separation & ID) Chemical Shift Chromatography
Why NMR? • 1H NMR • Rapid metabolite identification and quantification • Monitoring flux/kinetics in real time • 13C NMR • Metabolite sources/sinks, chemistry • 31P NMR • ATP/ADP ratios, energy balance, cAMP
25 PC2 20 15 pet191D 10 5 0 -5 WT -10 -15 pfk27D -20 PC1 -25 -30 -20 -10 0 10 pfk27D pet191D Wildtype Metabolomics and NMR Principle Component Analysis
Functional Proteomics via Metabolic Profiling Forster, J. et al., (2002) Biotechnol. Bioeng. Vol. 79, 703-712
Detecting Silent Mutations in Yeast Nature Biotechnology, vol. 19, pg. 45-50 (2001)
Is There A Better Way? • Why not try to identify the individual peaks in an NMR spectrum automatically? • Use software to deconvolute individual spectral signatures using a database of known compounds • Use relative peak intensity to quantify • Gives identification and quantitation • Possibility of chemical shift microscopy
Mixture Compound A Compound B Compound C Spectral Deconvolution of a Mixture Containing Compounds A, B and C
Data Analysis (Principles) Glucose Fit Extract Spectrum Fructose Fit
Data Analysis (Principles) Fructose Fit Extract Spectrum Glucose Fit
Data Analysis (Principles) Glucose and Fructose Fit Extract Spectrum Fructose + Glucose Glucose Fit
Data Analysis • Fitting 5-10 rounded peaks is trivial, fitting 1000+ sharp peaks is not, i.e. dense matrix problem with very high probability of cumulative rounding errors and singularities(LLSOL - Stanford) • Peak positions & shapes dependent on salt, pH, temperature, ligands, ligand/ion interactions, shimming, signal-to-noise digital resolution, phasing, field strength, etc. etc. • Requires special databases - key innovation • Requires “intelligent” data preprocessing - (ditto) • Partnered with Chenomx/Varian Eclipse
(+)-(-)-Methylsuccinic Acid 2,5-Dihydroxyphenylacetic Acid 2-hydroxy-3-methylbutyric acid 2-Oxoglutaric acid 3-Hydroxy-3-methylglutaric acid 3-Indoxyl Sulfate 5-Hydroxyindole-3-acetic Acid Acetamide Acetic Acid Acetoacetic Acid Acetone Acetyl-L-carnitine Alpha-Glucose Alpha-ketoisocaproic acid Benzoic Acid Betaine Beta-Lactose Citric Acid Creatine Creatinine D(-)Fructose D-(+)-Glyceric Acid D(+)-Xylose Dimethylamine DL-B-Aminoisobutyric Acid Current Compound List • L-Isoleucine • L-Lactic Acid • L-Lysine • L-Methionine • L-phenylalanine • L-Serine • L-Threonine • L-Valine • Malonic Acid • Methylamine • Mono-methylmalonate • N,N-dimethylglycine • N-Butyric Acid • Pimelic Acid • Propionic Acid • Pyruvic Acid • Salicylic acid • Sarcosine • Succinic Acid • Sucrose • Taurine • trans-4-hydroxy-L-Proline • Trimethylamine • Trimethylamine-N-Oxide • Urea • DL-Carnitine • DL-Citrulline • DL-Malic Acid • Ethanol • Formic Acid • Fumaric Acid • Gamma-Amino-N-Butyric Acid • Gamma-Hydroxybutyric Acid • Gentisic Acid • Glutaric acid • Glycerol • Glycine • Glycolic Acid • Hippuric acid • Homovanillic acid • Hypoxanthine • Imidazole • Inositol • isovaleric acid • L(-) Fucose • L-alanine • L-asparagine • L-aspartic acid • L-Histidine • L-homocitrulline
Metabolomics & E. coli • 25-50 mL shake flasks or large 0.5L flask • Remove aliquots at regular intervals • Analyze cells or media or both? • Cells • Lysis protocol, sonication? freeze-thaw? soluble fraction? lipid fraction? protein rmvl • Media • Rich (LB)? Defined? MOPS? M9? glucose?
M9-Glucose MOPS
A “Toy” Problem • Succinate Dehydrogenase is a key enzyme in the aerobic TCA cycle (converts succinate to fumarate) • Fumarate Reductase is responsible for converting fumarate to succinate under anaerobic conditions • Fumarate Reductase & Succinate Dehydrogenase share ~60% sequence identity
Fumarate Reductase The TCA Cycle Acetate Acetyl-CoA Glycerol Pyruvate Oxaloacetate Citrate Isocitrate L-Malate -Ketoglutarate Fumarate 2 1 Succinate dehydrogenase Succinate Succinyl-CoA
Questions • Can Fumarate Reductase (FumR) substitute for Succinate Dehydrogenase (SucD)? • Can we detect any phenotypic differences between WT vs. SucD- vs. SucD-/FumR-? • Can NMR-based metabolomics be used to detect mutations/characterize phenotypes?
StrainsGenotypePhenotype Succingate dehydrogenase Fumarate Reductase. MC4100 Rapid Growth DW35 Slow Growth Double knockout Slow Growth DW35/pH3 Fumarate Reductase. Methods • Obtain 3 E. coli strains as shown below
Methods • Grow Cells on Glycerol Minimal Media at 37 degrees • Collect 3 mL aliquots every hour for 30+ hours or until cells die • Monitor pH and OD600 • Spin down cells, retain supernatant • Lyse cells with chloroform/water, spin down • Analyze cell extracts & supernatant by NMR
Metabolic Responses Acetate Glycerol Pyruvate Acetate Glycerol Pyruvate Succinate Succinate