Download
1 / 12
120 likes | 289 Views
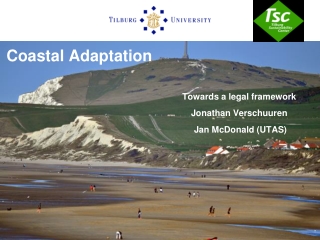
Mapping Social Indicators for South East Coastal Adaptation project. Yogi Vidyattama, Binod Nepal and Itismita Mohanty The National Centre for Social and Economic Modelling (NATSEM) SECA Researchers’ May 2012 Workshop University of Canberra. Background.

E N D
Mapping Social Indicators for South East Coastal Adaptation project Yogi Vidyattama, Binod Nepal and Itismita Mohanty The National Centre for Social and Economic Modelling (NATSEM) SECA Researchers’ May 2012 Workshop University of Canberra
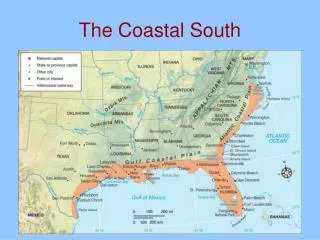
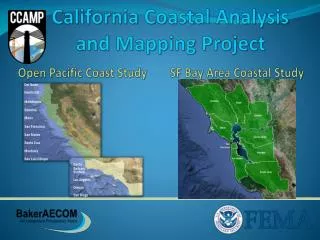
Background • NCCARF Grant on Coastal urban climate futures in SE Australia. • need for some economic, social and demographic profiling of coastal communities from Wollongong to Lakes Entrance • to be considered for further analysis using fieldwork • The ten communities currently identified • NSW: Wollongong, Batemans Bay, Narooma, Eden, Tuross head, Bermagui, North Durras, Tathra • Victoria: Lakes entrance, Mallacoota
Data Sources • ABS Population and Housing Census (2006) • Age, Gender, Family, Housing Tenure, Employment, Education, Income, Volunteering by Various geographical unit • ABS National Regional Profile (2009/2010) • Various variable including income (ATO) by SLA • DEEWR Small Area Labour Market (SALM) data • Unemployment and Labour force participation by SLA (2011) • Treasury Intergerational Report • Changes in Labour force status by age (2007 and projection) • DOHA, NSW and Victoria Department of Planning • Population projection by age groups by SLA (5 yearly to 2031) • PHIDU Interactive Social Health Atlas • Various Health Indicators (2006,2007/2008) by SLA
Requested data • Median Income (2011 and 2021) • Change in Income • Age/Sex Profile (2011 and 2021) • Change in Age/Sex Profile • Family Types (2011) • Unemployment and Youth Unemployment Rate (2011) • Poverty Rates (2011 and 2021) • Income Inequality (2011 and 2021) • Self Assessed Health (2007-08) PHIDU • Voluntary Work (2006) Census • Other SpatialMSM Projection
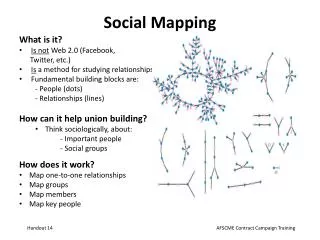
Spatial Microsimulation • Definition: • The use of individual characteristic in survey data to do estimation at Specific Geographical Location • Reweight unit record file from survey data based on the constraints from Census small area level data • Variables have to be available in both data set • SpatialMSM • Households record data of 2005-06 and 2007-08 ABS Surveys of Income and Housing • Constrained or Benchmark to 2006 Census • Reweighting the households unit record data using GREGWT
Spatial Methodology : Reweighting Method turning the national household weights in the SIH 02-03 and 03-04 file into … … household weights of small-areas
Surveys reweighted to following 2006 Census benchmark tables Note: SpatialMSM/08C.Most Benchmark Tables contain the total number of persons or households in occupied private dwellings (OPD) except for Table 2 and Table 9. These tables include people in non-private dwellings. People in non-private dwellings include people in prisons, hospitals, aged care facilities, etc
Projecting SpatialMSM • Projecting age by sex by labour force status benchmark table • combine SLA-level population projections (to 2027) from the ABS (or State Government Projection) with (national) projections of labour force status from the Treasury’s 2007 Inter Generational Report (IGR) and DEEWR small area Labour force market data • Projecting the other 10 benchmark tables • obtain the coefficients used to project other benchmark tables • the population growth in each benchmark table can be projected as • Increasing income using Tax income from NRP
Issue • Although SpatialMSM could produce data at Urban Centre or Locality (UCL) unit • It will largely reflect the projection of the SLA • We use SLA instead
Result Include all SLAs in NSW and Victoria as comparison
Result • We put the result in the interactive map • http://web.natsem.canberra.edu.au/maps/NCCARF/atlas.html • Locally at ACR MAPS\Atlas\atlas.html • may be updated by the end of the month • Laminated big map • Sample • Based on request