Download
1 / 26
270 likes | 531 Views
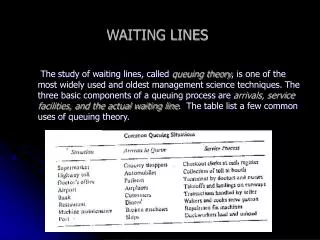
Terminology and Classification of Waiting Lines. Terminology : The characteristics of a queuing system is captured by five parameters: Arrival pattern Service pattern Number of server Restriction on queue capacity The queue discipline. Terminology and Classification of Waiting Lines. M/M/1

E N D
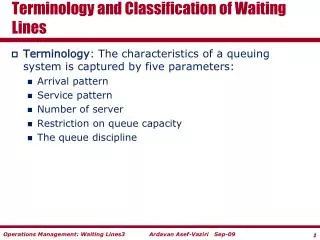
Terminology and Classification of Waiting Lines • Terminology: The characteristics of a queuing system is captured by five parameters: • Arrival pattern • Service pattern • Number of server • Restriction on queue capacity • The queue discipline
Terminology and Classification of Waiting Lines • M/M/1 • Exponential interarrival times • Exponential service times • There is one server. • No capacity limit • M/G/12/23 • Exponential interarrival times • General service times • 12 servers • Queue capacity is 23
Problem 1: M/M/1 Performance Evaluation Example: The arrival rate to a GAP store is 6 customers per hour and has Poisson distribution. The service time is 5 min per customer and has Exponential distribution. • On average how many customers are in the waiting line? • How long a customer stays in the line? • How long a customer stays in the processor (with the server)? • On average how many customers are with the server? • On average how many customers are in the system? • On average how long a customer stay in the system?
M/M/1 Performance Evaluation R = 6 customers per hour Rp =1/5 customer per minute, or 60(1/5) = 12/hour r = R/Rp = 6/12 = 0.5 On average how many customers are in the waiting line?
GAP Example How long a customer stays in the line? On average how many customers are with the server? How long a customer stays in the processor (with the server)?
M/M/1 Performance Evaluation On average how many customers are in the system? On average how long a customer stay in the system?
Problem 2: M/M/1 Performance Evaluation • What if the arrival rate is 11 per hour?
M/M/1 Performance Evaluation As the utilization rate increases to 1 (100%) the number of customers in line (system) and the waiting time in line (in system) is increasing exponentially.
Problem 3: M/G/c A local GAP store on average has 10 customers per hour for the checkout line. The inter-arrival time follows the exponential distribution. The store has two cashiers. The service time for checkout follows a normal distribution with mean equal to 5 minutes and a standard deviation of 1 minute. • On average how many customers are in the waiting line? • How long a customer stays in the line? • How long a customer stays in the processors (with the servers)? • On average how many customers are with the servers? • On average how many customers are in the system ? • On average how long a customer stay in the system ?
The Key Information Arrival rate: R = 10 per hour Average interarrival time: Ta = 1/R = 1/10 hr = 6 min Standard deviation of interarrival time: Sa Service rate per server: 12 per hour Average service time: Tp= 1/12 hours = 5 min Standard deviation of service time: Sp= 1 min Coefficient of variation for interarrivals : Ci= Sa/Ta = 1 Coefficient of variation for services: Cp= Sp/Tp = 1/5 =0.2 Number of servers: c =2 Rp = c/Tp = 2/(1/12) = 24 per hour ρ = R/Rp = 10/24 = 0.42
M/G/2 On average how many customers are in the waiting line? How long a customer stays in the line? How long a customer stays in the processors (with the servers)? • Average service time: Tp= 1/12 hours = 5 min
M/G/2 On average how many customers are with the servers? On average how many customers are in the system ? On average how long a customer stay in the system ?
Comment on General Formula • Approximation formula gives exact answers for M/M/1 system. • Approximation formula provide good approximations for M/M/2 system.
Problem 4: M/M/c Example A call center has 11 operators. The arrival rate of calls is 200 calls per hour. Each of the operators can serve 20 customers per hour. Assume interarrival time and processing time follow Poisson and Exponential, respectively. What is the average waiting time (time before a customer’s call is answered)?
Problem 5: M/D/c Example • Suppose the service time is a constant • What is the answer of the previous question? • In this case
Effect of Pooling Ri=R= 10/min Tp= 5 secs Interarrival time Poisson Service time exponential Ri/2 Server 1 Queue 1 Ri Ri/2 Server 2 Queue 2 Server 1 Ri Queue Server 2
Effect of Pooling : 2M/M/1 Ri/2 Server 1 Ri/2 = R= 5/min Tp= 5 secs C = 1 Rp = 12 /min = 5/12 = 0.417 Queue 1 Ri Ri/2 Server 2 Queue 2
Comparison of 2M/M/1 with M/M/2 Ri/2 Server 1 Queue 1 Ri Ri/2 Server 2 Queue 2 Server 1 Ri Queue Server 2
Effect of Pooling: M/M/2 Ri=R= 10/min Tp= 5 secs C = 2 Rp = 24 /min = 10/24 = 0.417 AS BEFORE for each processor Server 1 Ri Queue Server 2
Effect of Pooling • Under Design A, • We have Ri = 10/2 = 5 per minute, and TP= 5 seconds, c =1, we arrive at a total flow time of 8.6 seconds • Under Design B, • We have Ri =10 per minute, TP= 5 seconds, c=2, we arrive at a total flow time of 6.2 seconds • So why is Design B better than A? • Design A the waiting time of customer is dependent on the processing time of those ahead in the queue • Design B, the waiting time of customer is only partially dependent on each preceding customer’s processing time • Combining queues reduces variability and leads to reduce waiting times
Performance Improvement Levers • Decrease variability in customer inter-arrival and processing times. • Decrease capacity utilization. • Synchronize available capacity with demand.
1. Variability Reduction Levers • Customers arrival are hard to control • Scheduling, reservations, appointments, etc…. • Variability in processing time • Increased training and standardization processes • Lower employee turnover rate more experienced work force • Limit product variety, increase commonality of parts
2. Capacity Utilization Levers • If the capacity utilization can be decreased, there will also be a decrease in delays and queues. • Since ρ=R/Rp, to decrease capacity utilization there are two options • Manage Arrivals: Decrease inflow rate Ri • Manage Capacity: Increase processing rate Rp • Managing Arrivals • Better scheduling, price differentials, alternative services • Managing Capacity • Increase scale of the process (the number of servers) • Increase speed of the process (lower processing time)
3. Synchronizing Capacity with Demand • Capacity Adjustment Strategies • Personnel shifts, cross training, flexible resources • Workforce planning & season variability • Synchronizing of inputs and outputs, Better scheduling