Download
1 / 44
470 likes | 516 Views
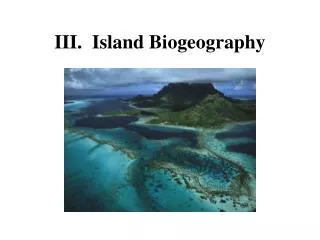
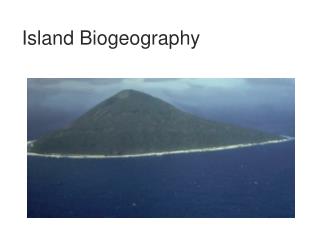
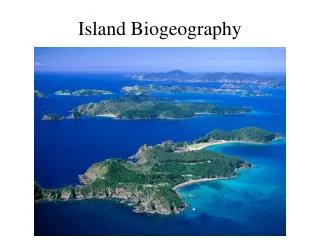
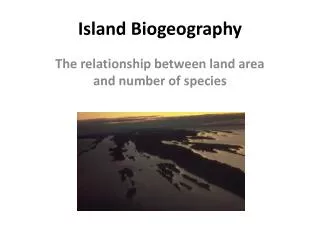
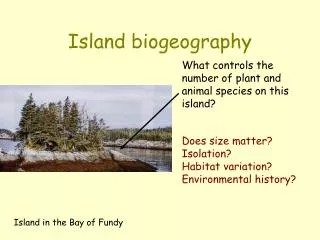
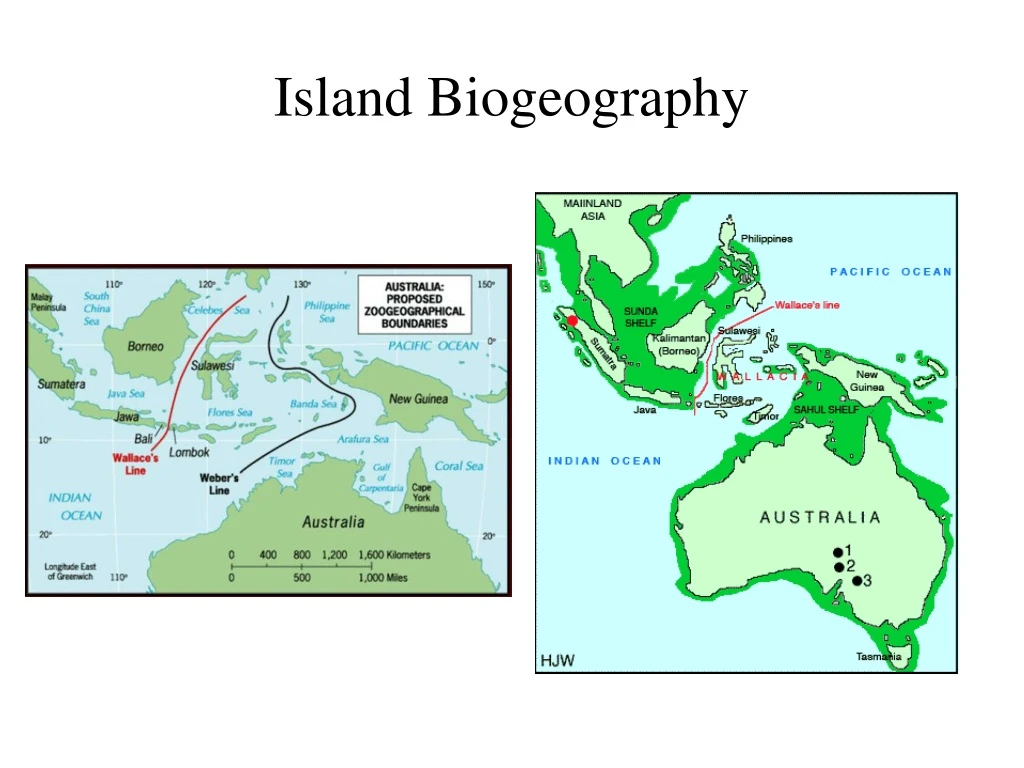
Island Biogeography. Habitat Islands In the Great Basin Top – Birds, Bottom - Mammals. Species-Area Curves for Islands. S = cA z where: S = number of species A = area of island c = constant for habitat type - forest, desert, grassland

E N D
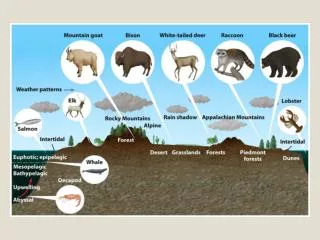
Habitat Islands In the Great Basin Top – Birds, Bottom - Mammals
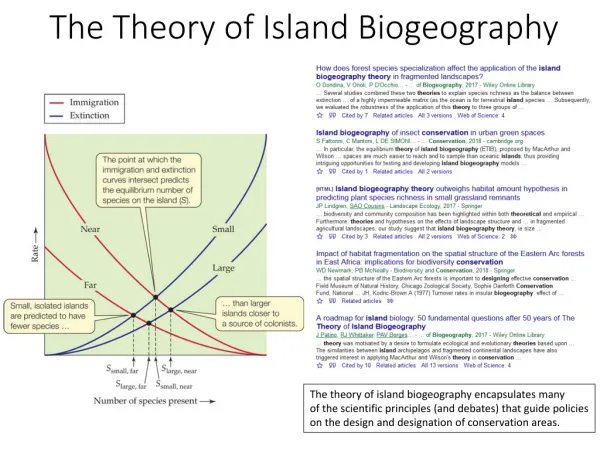
Species-Area Curves for Islands S = cAz where: S = number of species A = area of island c = constant for habitat type - forest, desert, grassland z = slope of the curve - predicted to be 0.263, but actually varies with dispersal ability
The slope of the line plotted for species-area curve is larger for species with poor dispersal abilities Oceanic islands birds - New Guinea islands z=0.22 beetles - West Indies z=0.34 land plants - Channel Islands z=0.37 Habitat islands birds - Andes paramo z=0.29 birds - mtns of Great Basin z=0.165 mammals - mtns of Great Basin z=0.326 inverts -caves in West Virginia z=0.72
Krakatoa pre-eruption Looking at Volcano Rakata
Results from Simberloff’s Experiment Islands recovered to pre-defaunation number of species, but only 30% of original species resident on each island returned after defaunation.
Bracken Fern
Some Energy Flow Definitions • Gross primary production (GPP) - total fixation of energy by autotrophs - usually just due to photosynthesis, primarily by plants • Net primary production (NPP) = GPP - respiration, autotrophs use some energy for their own growth and that is lost as respiratory heat, so NPP represents what is available to heterotrophs - NPP is often 10% of GPP • Secondary productivity - production of biomass by heterotrophs • Standing crop - amount of biomass of living organisms in a unit of area
P – productivity tn/ha/yr; B – biomass tn/ha; R - solar radiation – kcal/m2/yr
Limits to Terrestrial Productivity a) shortage of water restricts rate of photosynthesis b) shortage of mineral nutrients slows down rate of production of photosynthetic tissue and the effectiveness of photosynthesis c) temperatures that are lethal or too low for growth d) insufficient depth of soil (deserts, mountain tops) e) incomplete vegetation canopy cover so that much sunlight lands on the ground and not on foliage
Comparison of productivity by a deciduous tree and an evergreen tree
Limits to Aquatic Productivity • Lack of nutrients • Light is limiting – suspended particles in water reduce light penetration • Intensity of grazing