Download

1 / 37
400 likes | 731 Views
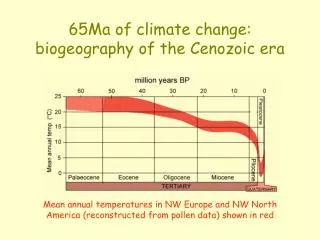
Island biogeography I: the idea. Bio 415/615. Questions. 1. What are the opposing forces of island biogeography? 2. Why do islands have fewer species than continental areas of the same size? 3. How has IBT been tested? 4. What is the rescue effect?. Recall species-area relationships.

E N D
Island biogeography I: the idea Bio 415/615
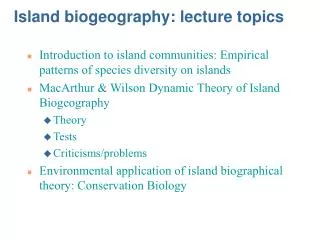
Questions 1. What are the opposing forces of island biogeography? 2. Why do islands have fewer species than continental areas of the same size? 3. How has IBT been tested? 4. What is the rescue effect?
Recall species-area relationships Habitat diversity Population size Bigger ranges Log Species Richness Log Area
Consider islands • Bigger islands should have more species than smaller islands. Why? • More habitats (or env circumstances) • Support larger populations • Can hold larger animals (e.g., big ranges) • What else determines how many species are on islands?
Island Observations • Islands have fewer species than samples within contiguous continental areas as a function of size • Islands have ever fewer species as they get smaller (z is higher) • Isolated islands have fewer species than less isolated islands of the same size
Beyond Islands: Habitat Loss & Fragmentation • Area decreases (Grain decreases) • Isolation increases (Distance increases) • Fewer species expected • Insularization
Occam’s principle of parsimony with a warning from Einstein One should not increase beyond what is necessary the number of entities required to explain anything William of Ockham Everything should be made as simple as possible but not simpler Albert Einstein
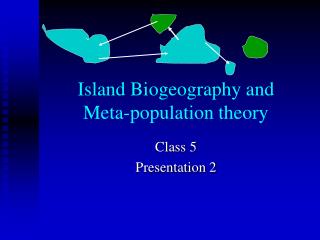
The Theory • Immigration, extinction • Straight to concave • Turnover • Near, Far • Large, Small
Immigration Rate High Rate of New Species Immigration Low Many 0 Number of Resident Species
Extinction Rate High Rate of New Species Immigration Rate of Extinction Low Many 0 Number of Resident Species
Equilibrium High Rate of New Species Immigration Rate of Extinction Equilibrium Turnover Low Many 0 Number of Resident Species
Isolation Far from Mainland Rate of New Species Immigration Rate of Extinction Number of Species
Area Large Island Rate of New Species Immigration Rate of Extinction Number of Species
Equilibrium Small, Far Island Rate of New Species Immigration Rate of Extinction Number of Species
Equilibrium Small, Close Island Rate of New Species Immigration Rate of Extinction Number of Species
Equilibrium Large, Close Island Rate of New Species Immigration Rate of Extinction Number of Species
Equilibrium Large, Far Island Rate of New Species Immigration Rate of Extinction Number of Species
Extensions of Theory • Target effect • Rescue effect I E Distance MW Rescue Area Target MW
Rescue effect Isolation influences extinction rates of extant species too, by ‘rescuing’ them from extinction through continuous supply of more individuals Brown & Kodric-Brown 1977
Area and Isolation Bigger islands are bigger ‘targets’ for colonization Target Effect Rate of New Species Immigration Rescue Effect Rate of Extinction Number of Species
Extensions of Theory • Target effect • Rescue effect • Landscape ecology: matrix, patch quality, corridor
Land bridge islands Barro Colorado Island, Panama 1. Hilltop = 15.7 km2 of lowland tropical forest. 2. Isolated in 1914 when Lake Gatun was formed by construction of the Panama Canal. 3. Knowing area and period of isolation, can model extinction. 4. 108 species of breeding birds in 1938. 5. Terborgh used land bridge model to predict 17 would be lost in 50 years; really 13 = 12% of 108.
The 3 Step Process of Species Loss and Extinction Debt Instantaneous Fast Slow Sampling Isolation Area
The 3 Step Process of Species Loss and Extinction Debt Instantaneous Fast Faster & Greater Loss as Area Slow
The 3 Step Process of Species Loss and Extinction Debt Instantaneous Fast Faster & Greater Loss as Area Slow
The 3 Step Process of Species Loss and Extinction Debt Instantaneous Fast Faster & Greater Loss as Area Slow Extinction debt Steeper z