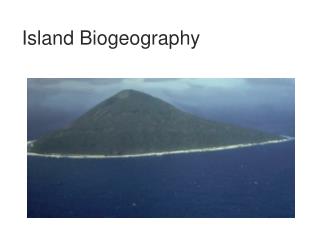
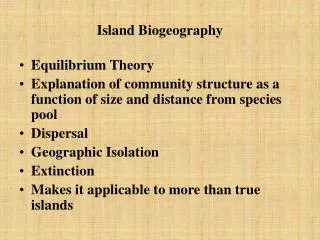
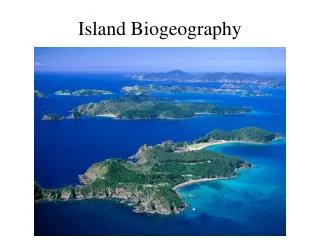
Island Biogeography
Island Biogeography. Explore the relationships of I and E rates and S to island area and distance Observe the accumulation of sp on an island, and the approach of I and E rates and S values to equilibrium Find equilibrium values of I and E and sp


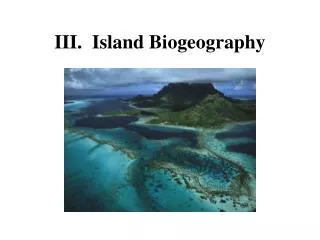
Island Biogeography
E N D
Presentation Transcript
Island Biogeography • Explore the relationships of I and E rates and S to island area and distance • Observe the accumulation of sp on an island, and the approach of I and E rates and S values to equilibrium • Find equilibrium values of I and E and sp • Understand species-area curves and the underlying mathematical relationships • Explore interaction effects of A & D
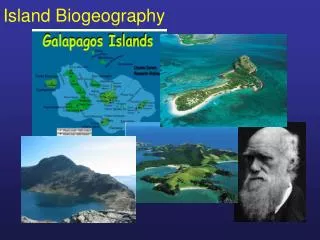
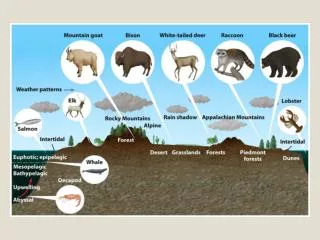
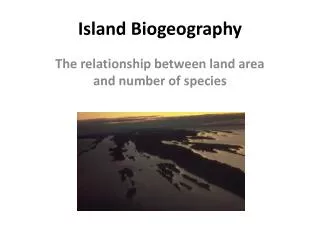
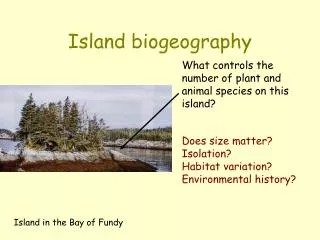
Island Biogeography • Larger islands and closer islands support a greater number of species than smaller or more distant islands • These relationships can be described as ‘species-area’ or ‘species-distance’ • These patterns not only hold for true oceanic islands, but also mountain tops, lakes, and other habitat ‘islands’
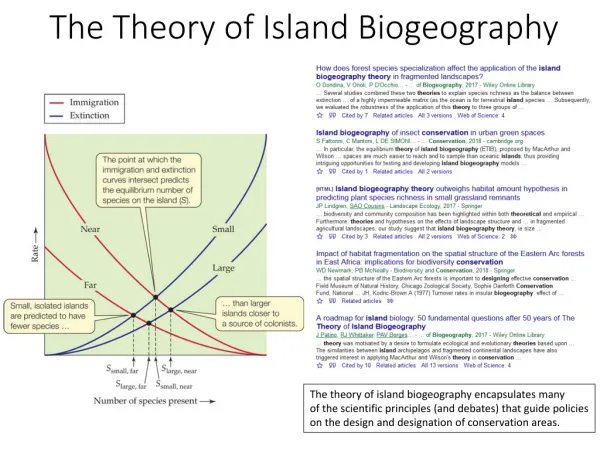
Island Biogeography • So what mechanism (or process) generates this pattern? • MacArthur and Wilson (1967) modeled species richness as the result of two processes: I and E • Equilibrium theory of island biogeography
Island Biogeography • I rate is determined by 3 factors: • Distance, # sp remaining in mainland pool, probability a given sp will disperse • E rate is determined by 3 factors: • Island area, # of sp on island, probability that a given sp will go extinct
Island Biogeography • In the simplest version of the model, all sp have equal probability of I & E • Realistically, I should be inversely related to D • I=imm rate, P=mainland sp pool, S=island richness, D=distance, c=colonization probability, f=scaling factor for distance (which have been estimated c=0.1, f=0.01) I = c (P-S) / f D
Island Biogeography • Consider E • E=extinction rate, S=sp richness on island, A=area, q=extinction probability, m=power factor scaling for area • Values for q and mmust be derived from the data ((q=0.20, m=0.25) E = qS / Am
Island Biogeography • Consider Eq. 1, you can see species accumulate on an island, I will decrease • Conversely, as S increases, E increases • At some intermediate value, I and E will become equal and the S will be in equilibrium I = c (P-S) / f D E = qS / Am
Graphical model of one variation of MacArthur-Wilson Dynamic Theory of Island Biogeography
Island Biogeography • 2nd important point, the equilibrium point of S is a dynamic equilibrium • At this point, I=E, but neither is 0 and consequently, there is turnover
Graphical model of one variation of MacArthur-Wilson Dynamic Theory of Island Biogeography Turnover Rate
Island Biogeography • This model has been widely adopted for conservation purposes, but do you see any potential flaws?
Island Biogeography • The rate at which species are accumulated by increasing area is the slope • All else being equal, more sp on a given area of mainland supports more than same area of island
Z-values (slope in species-area curve) tend to be lower in groups that disperse well (such as birds, graph b) than in groups that show more effect of isolation (such as mammals, graph c)
Island Biogeography • Let’s look at the model graphically and consider a few special cases
Final pattern: Isolation effect, shown by fewer species on isolated islands, in species-area curve for birds of warm ocean regions: red triangles represent isolated islands (>300 km from next largest land mass) (from Paul Slud) Cocos Island, Costa Rica
Both isolation (distance) effects on immigration, and island size (area) effects on extinction, combined into one model--showing different predicted equilibrium species richness values
Rescue Effect of island distance (isolation), area held constant S EL