Download
1 / 22
220 likes | 396 Views
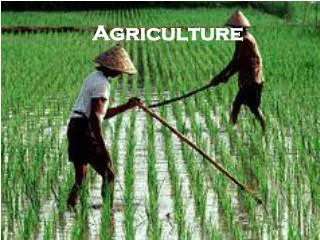
Agriculture Sector GHG Inventory: Issues and Concerns for India Sumana Bhattacharya 10 th February 2005 Shanghai, China. National Emissions - 1994. 743820. Sectoral Distribution of Emissions. Gas by Gas distribution across sectors. CH 4. Waste. 6%. All energy. 16%. Agriculture. 78%.

E N D
Agriculture Sector GHG Inventory: Issues and Concerns for India Sumana Bhattacharya 10th February 2005 Shanghai, China
National Emissions - 1994 743820
Gas by Gas distribution across sectors CH4 Waste 6% All energy 16% Agriculture 78% CO2 N2O
Key lessons • Many activity data gaps exist, especially for reporting as per 17/CP.8, requiring major national efforts • Procedures of reporting and collecting data for future inventories need to be established – reliability, coverage, and availability • Sample size need to be enlarged for many categories to capture regional diversity in emission coefficients
Institutional Arrangement Ministry of Environment and Forests Technical Advisory SteeringCommittee Project Management Cell Inventory UR
GHG Emission Distribution- Agriculture Key sectors 1. Enteric fermentation 2. Rice Cultivation 3. Soils Uncertainty Reduction Efforts Rice Cultivation Enteric fermentation
Status of Preparation GHG inventory – Agriculture Status of Preparation GHG inventory – Agriculture I: Indigenously developed, D: IPCC Default Emission factors
Typicality's of Agriculture Sector in India Livestock 80% indigenous low producing, non-descriptive with low feed req.- population going down Crossbred increasing Total population is projected to decrease Manure not collected systematically Rice cultivation Total area almost constant over the years, Area under rainfed fluctuates Not much cultivation on organic soils
Typicality's of Agriculture Sector in India Crop Residue Crop residue mostly used as fuel Burnt on fields at few places Soils Diverse agriculture soils and management practices Pattern and amount of fertilizer applied varies across regions No quantification yet of application of organic fertilizers
Key lessons – Agriculture sector Methane and nitrous oxide emissions emitted from the agriculture sector come from dispersed sources and hence are more uncertain w.r.t those from energy sources Therefore procedures of reporting and collecting activity data for future inventories need to be established for improving their reliability, coverage, and availability Sample sizes of measurements need to be enlarged for many categories to capture regional diversity in emission coefficients Many activity data gaps exist, especially for estimating N2O from soils
Enteric Fermentation Data gathered on: Livestock statistics Survey undertaken every 5 years (1987,1992, 1997,2003) Interpolation necessary- Identification and categorization of livestock species Milk Production Same method Body weight Body weights of the indigenous cattle (constituting 80% of total population not well documented) not well documented Feed Intake Based on DMI - literature survey, regional variation exists in the type of feed. Extensive survey necessary Methane Conversion Factor Data on methane from % of gross energy converted /dry matter intake confined to higher bred
Aggregate national emission factor Measurement based Activity Data based Few CH4 measurements made for cross bred cattle using face mask - SF6 technology • Body weights - published reports • BW of non-descript cattle taken 20% less than well-described breed. • DMI as percentage of body weight based on literature survey and expert judgment. • Feed intake in terms of kg DMI/100 kg livestock body weight / day is estimated. • Methane conversion factor in g CH4/kg DMI from published reports and dry matter intake of animals.
Direct measurements - Enteric Fermentation Sample size, statistically not adequate, all cattle types not covered. CH4 emission varies with temp. Therefore extensive measurements at all climate regions requires covering both indigenous and cross bred cattle.
Manure Management Based on animal population statistics and IPCC default emission factors Three aspects to be noted Manure is not systematically collected Where it is collected, it is - dried as dung cakes and used as fuel - collected for bio gas plants for CH4 use as energy Therefore over estimation in the 1st communication
Rice Cultivation Govt. reports on rice harvest area under cultivation are in terms of irrigated rainfed Distribution of harvest area according to IPCC in India made based on area under various soil types and type of water management Data on application of Organic Carbon not available Emission factors for all rice ecosystems not statistically significant Measurements of CH4 flux vs. different rice cultivars are minimal
CH4 emission measurements from rice cultivation Chamber Box technique – samples collected and analysed using Gas chromatography Based on extensive measurements carried out between 1991 and 2002 for different cultivars Inter comparison of samples with national & international standards Measurements made over the entire cropping season for different water regimes Classification of areas under various water regimes based on soil characteristics Onsite CH4 measurement
Crop Residue Activity data is crop production based Residue to crop ratio determined so far only for selected crops Extensive surveys required to estimate the Fraction left on field for burning – now based on expert judgement Dry matter fraction needs to be studied further in terms of crop produced, irrigation practices, and other farming practices Emission factors of CO, CH4, NOx, NMVOC – Inadequate measurements
Emission from soils N2O emissions data requirements: Synthetic fertilizer – fraction of nitrogen that volatilizes as NH3 and NOx from applied synthetic fertilizer needs to be country specific, including factors due to leaching & runoff Application of animal manure Data on Incorporation of crop residue in soils Distribution of organic soils Disposal of sewage/effluents Extensive direct measurements to be made on all agricultural soils for all cropping systems