Download
1 / 7
70 likes | 193 Views
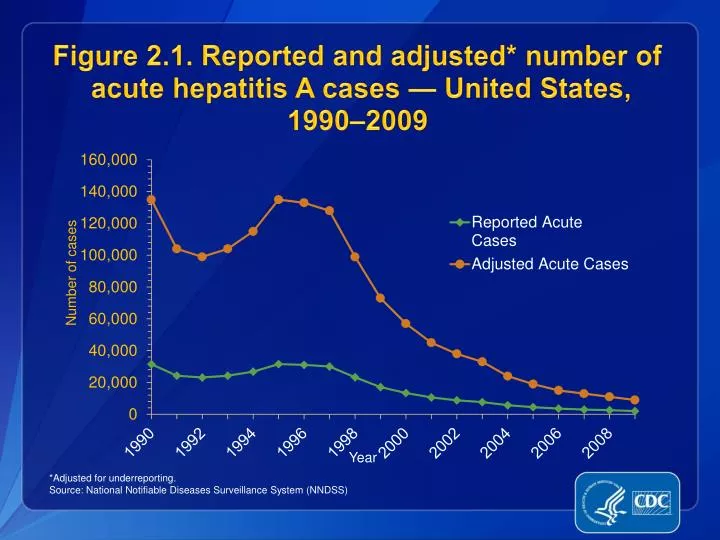
Figure 2.1. Reported and adjusted* number of acute hepatitis A cases — United States, 1990–2009. *Adjusted for underreporting. Source : National Notifiable Diseases Surveillance System (NNDSS ). Figure 2.2. Incidence of acute hepatitis A, by age group — United States, 1990–2009.

E N D
Figure 2.1. Reported and adjusted* number of acute hepatitis A cases — United States, 1990–2009 *Adjusted for underreporting. Source: National Notifiable Diseases Surveillance System (NNDSS)
Figure 2.2. Incidence of acute hepatitis A, by age group — United States, 1990–2009 Source: National Notifiable Diseases Surveillance System (NNDSS)
Figure 2.3. Incidence of acute hepatitis A, by sex — United States, 1990–2009 Source: National Notifiable Diseases Surveillance System (NNDSS)
Figure 2.4. Incidence of acute hepatitis A,by race/ethnicity — United States, 1990–2009 Source: National Notifiable Diseases Surveillance System (NNDSS)
Figure 2.5. Distribution of risk behaviors/exposures associated with acute hepatitis A — United States, 2009 290 15% Risk identified* 818 41% No risk identified No risk data reported 879 44% * Includes case reports indicating the presence of at least one of the following risks 2–6 weeks prior to onset of acute, symptomatic hepatitis A: 1) having traveled to hepatitis A-endemic regions of Mexico, South/Central America, Africa, Asia/South Pacific, or the Middle East; 2) having sexual/household or other contact with suspected/confirmed hepatitis A patient; 3) being a child/employee in day care center/nursery/preschool or having had contact with such persons; 4) being involved in a foodborne/waterborne outbreak; 5) being a man who has sex with men; and 6) using injection drugs. Source: National Notifiable Diseases Surveillance System (NNDSS)
Figure 2.6a. Acute hepatitis A reports*,by risk exposure† — United States, 2009 Sexual/household contact of hepatitis A-infected person 44 744 1199 31 Child/employee in a daycare center 1,032 Yes 924 No 45 Contact daycare center child or employee Missing § 866 1076 68 Food/waterborne outbreak 757 1162 16 Other contact with hepatitis A patient 772 1199 0 200 400 600 800 1000 1200 Number of cases *A total of 1,987 case reports of hepatitis A were received in 2009. †More than one risk exposure may be indicated on each case report. §No risk data reported. Source: National Notifiable Diseases Surveillance System (NNDSS)
Figure 2.6b. Acute hepatitis A reports*,by risk behavior† — United States, 2009 119 675 International travel 1193 9 Yes 804 Injection-druguse No 1174 Missing § 6 • Men who have sex with men ¶ 63 970 0 200 400 600 800 1000 1200 Number of cases *A total of 1,987 case reports of hepatitis A were received in 2009. †More than one risk behavior may be indicated on each case report. §No risk data reported. ¶A total of 1,039 hepatitis A cases were reported among males in 2009. Source: National Notifiable Diseases Surveillance System (NNDSS)