
Understanding Population Density and Distribution Worldwide
Explore the factors influencing population patterns globally, from clusters to birth rates, through key concepts like the Demographic Transition and mother and infant health indices.

Understanding Population Density and Distribution Worldwide
E N D
Presentation Transcript
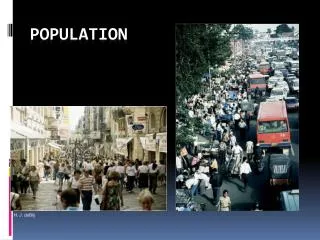
Chapter 2 POPULATION H. J. deBlij
Where in the World Do People Live and Why? • Arithmetic population density: Measure of total population relative to land area
Where in the World Do People Live and Why? • Arithmetic population density: Measure of total population relative to land area
Physiologic population density: Population per unit area of agriculturally productive land (takes this map into account)
Physiologic population density: Population per unit area of agriculturally productive land (takes this map into account)
Population distribution Descriptions of locations on the Earth’s surface where individuals or groups (depending on the scale) live D On this map, one dot represents 100,000 people
Population distribution Descriptions of locations on the Earth’s surface where individuals or groups (depending on the scale) live C A B On this map, one dot represents 100,000 people
Major World Population Clusters A. East Asia: ¼ of world population B. South Asia: Bound by the Himalayas to the north and a desert in Pakistan C. Europe: Population concentrated in cities D. North America: Megalopolis
Why Do Populations Rise or Fall in Particular Places? • Thomas Malthus • An Essay on the Principles of Population (1798) • Population growing exponentially • Food supplies growing linearly • What happened? • Expansion of food supply sources (globalization) • Increase in agricultural productivity (exponentially)
Total Fertility Rate (TFR) The average number of children per woman TFR needed to maintain the population size: 2.1
Total Fertility Rate (TFR) • The average number of children per woman • TFR needed to maintain the population size: 2.1
Rate of Natural Increase • Difference between births and deaths • Does not include immigration and emigration
Rate of Natural Increase Difference between births and deaths Does not include immigration and emigration
Doubling Time • Number of years for a population to double in size (like a bank deposit at compound interest) • Decreased doubling time (rapid growth), then increased doubling time (growth slowed down) Doubling time = 54 years Doubling time = 45 years
Population Growth in India Significant demographic variations within countries: Higher growth rates in northeastern India, lower rates in southeastern India
Population in India • 1950s: Population planning program • 1960s: National population planning program • 1970s: Beginning of forced sterilization program for men with 3 or more children; 22.5 million men sterilized • 2004: Beginning of guns-for-sterilization program in Uttar Pradesh • Today: Use of advertising and persuasion to lower birth rates in most states
World Birth Rates Number of births in a year per 1,000 people
World Birth Rates Number of births in a year per 1,000 people
World Death (Mortality) Rates Number of deaths in a year per 1,000 people
World Death (Mortality) Rates Number of deaths in a year per 1,000 people
The Demographic Transition • Changes in birth, death, and natural increase rates • Decline in death rates followed by decline in birth rates, resulting in a low or stable growth rate
Why Does Population Composition Matter? • Components of population composition • Gender distribution • Age distribution • Population pyramid: Graphic depiction of population by percentage in each age group, divided by gender
Population Pyramids for Poor Countries • High infant mortality • Short life expectancy • Rapid population growth
Population Pyramids for Wealthy Countries • Low infant mortality • Long life expectancy, especially for females • Little or no growth, even natural decrease
World Infant Mortality Deaths of babies less than one year of age, per 1,000 live births in a year
World Infant Mortality Deaths of babies less than one year of age, per 1,000 live births in a year
World Life Expectancy Number of years a person born now can expect to live
World Life Expectancy Number of years a person born now can expect to live
Mother’s Index • Based on 10 barometers of well-being among mothers and children • Strongly influenced by poverty and warfare
Mother’s Index Based on 10 barometers of well-being among mothers and children Strongly influenced by poverty and warfare
Diseases • Sources of diseases • Infectious diseases: Spread from person to person • Vectored: Spread through intermediary, such as an insect • Nonvectored: Spread directly from person to person • Chronic or degenerative diseases: Diseases of old age • Genetic or inherited diseases: Passed through genes • Spread of diseases • Endemic: Present in small area • Epidemic: Spreads over large region • Pandemic: Spreads worldwide
Causes of Death in the United States • Chronic diseases reflecting longer life expectances • Decline in deaths from infectious diseases
HIV/AIDS • Became worldwide concern in 1980s (but probably present in Africa before then) • Infection long before symptoms appear • Social stigma • Many deaths among young adults Effect of AIDS on population structure of South Africa
Drawing by a Pokot boy in Kenya, showing him working in the fields and caring for cattle to assist sick family members AIDS Impact on Children Sparrow Rainbow Village, a hospice for child AIDS patients near Johannesburg, South Africa
How Do Governments Affect Population Change? • Expansive population policies • Anti-capitalist ideologies (e.g., Maoist China, Soviet Union) • Combating declining birth rates, aging populations (e.g., Europe) • Eugenic population policies (e.g., Nazi Germany) • Restrictive population policies


