
Antiretroviral Drug Resistance at Low Plasma Levels: Patterns & Prevalence
Investigating prevalence & patterns of drug resistance at low viral loads to optimize therapeutic strategies in HIV patients. Analyzing resistance mutations in patients undergoing genotypic testing at low viral loads.

Antiretroviral Drug Resistance at Low Plasma Levels: Patterns & Prevalence
E N D
Presentation Transcript
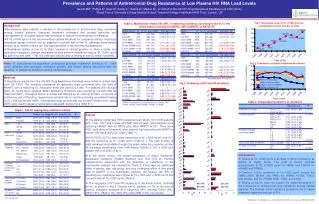
Prevalence and Patterns of Antiretroviral Drug Resistance at Low Plasma HIV RNA Load Levels Geretti AM1, Phillips A1, Kaye S2, Booth C1, Garcia A1, Mackie N2, on behalf of the UK HIV Drug Resistance Database and CHIC Study.1Royal Free & University College Medical School, 2Imperial College Healthcare NHS Trust, London, UK Table 3. Multivariate relative risk (RR) of detecting resistance according to the VL in the whole cohort, and while on NRTIs, NRTIs+NNRTI, or NRTIs+PI* • Background • Surveillance data indicate a decline in the prevalence of antiretroviral drug resistance among treated patients. Improved treatment strategies and prompt detection and management of virological failure may contribute to reduce the emergence of resistance. • A VL >1000 cp/ml is the recommended optimal threshold for resistance testing. Genotypic resistance assays however can be adapted to perform well at low VL, although some debate ensues as to whether results are fully representative of the dominant quasispecies. • Resistance testing at low VL is often required in clinical practice to allow a timely and optimised therapeutic change, and many centres perform resistance tests at VL <1000 cp/ml as part of routine care1,2. Yet, the yield and clinical utility of testing at low VL remain uncertain. Proportion (%) of total tests Aims:To characterise the population undergoing genotypic resistance testing at VL <1000 cp/ml, describe their genotypic resistance profiles, and identify factors associated with the detection of resistance mutations among treated patients. Prevalence (%) of resistance • Methods • Resistance results from the UK HIV Drug Resistance Database were linked to clinical data from UK CHIC. The analysis considered all resistance tests performed after the start of HAART, with a matching VL measured within the previous 4 wks. For patients with multiple tests, all results were included. Major resistance mutations were scored by the IAS-USA list (Sept-Oct 2007). Virological failure of a drug was defined by VL >400 cp/ml after >4 months of continuous use of the drug. Sequencing success rate in centres providing specialised testing at VL <1000 cp/ml was ≥85%. Generalized linear models with log link and Poisson error (using GEE) were used to assess multivariable (adjusted) relative risks (SAS 9.1). *Includes both PI and PI/r Fig 3. Frequency of RT and PR mutations Table 2. Independent predictors of resistance RAMS: Resistance-associated mutations; NAMs: NRTI RAMs; nNAMs: NNRTI RAMs; PRAMs: PI RAMs. Table 1. Cohort undergoing resistance testing • Results • The dataset comprised 7879 resistance test results, from 3795 patients with 1 test, 1817 with 2 tests and 2267 with ≥3 tests. Most patients were receiving HAART with ≥2 NRTIs plus either NNRTI or PI/r. There were 1621 tests done off treatment, after patients had discontinued HAART for median 542 days (IQR 236-1099) (Table 1). • 1001/7879 (12.7%) tests were performed at VL <1000 cp/ml (“low-VL”) and the remaining at VL >1000 cp/ml (“high-VL”). The total number of tests remained fairly stable through the years, while the proportion at low-VL increased significantly, from 3.4% before 1999 to 21.8% in 2006 (chi-square test, p<0.0001) (Fig 1). • In the whole cohort, the overall prevalence of major resistance-associated mutations (RAMs) declined over time (Fig 2). Factors independently associated with the detection of resistance in the multivariate analysis are indicated in Table 2. There was no significant effect of gender, age, risk group, and only a marginal effect of time since start of HAART. In the multivariate analysis, the relative risk (RR) of detecting any resistance was highest at VL ≥1000 and <10000 cp/ml and overall similar at VL<1000 cp/ml (Table 3). • The frequency of RT and PR mutations in the whole cohort, stratified by VL, is shown in Fig 3. Among low-VL patients on PIs at the time of testing, mutations detected at a frequency ≥5% included D30N (5%), M46I (10%), V82A (11%), I84V (5%) and L90M (14%) (not shown). Conclusions • Testing at VL <1000 cp/ml is as likely to detect resistance as testing at higher levels. The yield of testing declines progressively at VL ≥10000 cp/ml for NAMs and ≥30000 for nNAMS and PRAMs. • Common (>5%) mutations at VL<1000 cp/ml include the NAMs K65R, M184V, and TAMs, the nNAMs K103N, Y181C and G190A, and the PRAMs M46I, V82A, and L90M. • Testing at low-VL does not explain the observed decline in the prevalence of antiretroviral drug resistance among treated patients. The findings rather indicate a protective role of newer treatment regimens and use of PI/r. % % *chi-square test References: 1. Mackie et al, J Virol Methods 2004; 2. Cane et al, HIV Med 2008


