Global and Local Optimization Techniques for Oil Reservoir Parameter Estimation
This study focuses on the development of optimization software for accurate oil reservoir production forecasting. It employs a dual approach of global and local optimization methods, leveraging the tunneling technique to navigate complex parameter spaces. The research highlights the importance of solving a system of partial differential equations to simulate production, incorporating initial and boundary conditions. By addressing both direct and inverse problems, we seek to accurately characterize porous media properties such as permeability and porosity, while effectively handling uncertainty and achieving robust parameter estimation.

Global and Local Optimization Techniques for Oil Reservoir Parameter Estimation
E N D
Presentation Transcript
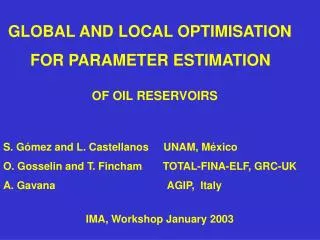
GLOBAL AND LOCAL OPTIMISATION FOR PARAMETER ESTIMATION OF OIL RESERVOIRS S. Gómez and L. Castellanos UNAM, México O. Gosselin and T. Fincham TOTAL-FINA-ELF, GRC-UK A. Gavana AGIP, Italy IMA, Workshop January 2003
Objectives Develop Global Optimisation Software to have: Accurate Production Forecast of oil reservoirs Speed and Robustness to get a useful tool Within the Tunneling method Frame: Local Optimisation methods Scaling and regularising
Direct problem To predict the production of a reservoir • It is necessary to solve a system of PDE equations in 3-D, with initial and boundary conditions to simulate the flux, to obtain, for each production well: the state variables (presure and saturation) Bottom-Hole pressure (bhp) Water cut (wct) Gas-oil ratio (gor) In this work this system is solved by the oil simulator ECLIPSE (like a black box)
Direct problem The flux equations depend non-linearly on certain coefficients p(x,y,z)that characterizethe porous media p(x,y,z): permeability and porosityof the porous media We call the solution of the flux equations Mod (p) In general the direct problems: Cause p(x,y,z) Effect pres & sat Simulation Forecast
Inverse problem Characterize the reservoir: Find the properties of the porous media p(x,y,z), whichare not known, using available information on the solution of the model Mod(p) (pres. and sat.) measured on the wells data (x, y, z, t ) i j k Inverse: known not-known effect cause In principle p has to satisfy Mod( p) = data
Then, to be able to predict production, we need to find first the characteristics of the porous media, permeability and porosity of the whole area, solving an inverse problem. Once the inverse problem is solved, we can solve the flux equations, for future periods of time (prediction) .
These parameters can be obtained solving an optimisation problem: History Matching minimising a least squares error criteria or missfit function, so that the simulation model of the reservoir approximates themeasured dataclosely Find the'optimal'parameters p : permeability and porosity subject to known bounds on the parameters
thedataare the measured values of observable quantities bottom-hole pressure (bhp) water-cut gas-oil ratio Mod ( p )is their calculated values from a reservoir simulation with a certain set of values of parameters p The indexjruns over the number of wells The indexiof the measurements for each well denotes the normalisation factor for a given observable data.
This inverse problem is ill-posed: I. The problem is non-convex many local solutions II. Non-continuous dependence on the data: Regularisation is needed to get the best possible approximation, preventing unbounded magnification of the data-error The parameterization of p(x,y,z) adds uncertainty in the problem formulation
Regularisation • Tikhonov, accurate solutions only with optimal parameter and to find is expensive. Theory well developed for linear problems, but for non-linear it is still an open question • Multiscale Optimisation (G. Chavent), very good numerical results in seismic inversion (Chavent, Clement, Gomez), and in water reservoirs (Gomez, Perez, Alvarez) but difficult to implement with Tunneling + black box simulator • Here, Conjugate Gradient + L-curve to get stable directions within the T-Gauss-Newton Local method.
In order • to get many local optimal solutions • to deal with non-continuity • to deal with uncertainty THE GOAL is to get the set of stable optimal solutions that produce a good match to the data : alternative SCENARIOS of production
Global Optimisation Local optimisation methods only find one local minimumthat may not fit the data or that may not give the best fit. We use our global optimisation method: The Tunneling Method
f(x) min tunnel min tunnel x
The Tunneling Method • obtains a sequence of local minima with decreasing values of the missfit function It has two phases: Minimisation Phase .- Finds a local minimum x* Tunnelisation Phase .- Finds a point x in another valley
Minimisation phase Given x0find a local minimum x*with f* We can use any local optimisation method ( gradient - based ) with bound constraints Here we test • Limited Memory Quasi-Newton LBFGSB (Nocedal et al) • Truncated Gauss-Newton TRON (More et al)
Tunneling Phase Once a local minimum x* has been obtained with f *, to be able to tunnel from one valley to another, that is Find x0B such that T( x0 ) = f ( x0 ) - f * 0 using the same local gradient-type method, it 1) creates a pole to destroy the local minimum 2) solves an inequality problem T(x) 0
The Tunneling Phase f(x) x x
Creates a pole to destroy the minimum x T ( x ) T (x) 0 = x° solution X* x
To place a pole atx* we use one of the following 1. Classical Tunneling function, 2. Exponential Tunneling function, Where * is the strength of the pole . is the squared euclidean norm
Exponential Tunneling effect of lambda : l *= (0.1, 0.4, 0.9) T(x) x
Effect of l Classical Tunneling Exact minimum at x= -0.127153 l* = 1(blue), 2, 3
Effect of l :When the minimum is not exact x* = -.2 For l = 1 , in the direction where f(x) < f* the pole does not destroy the minimum, a descent direction is not possible for T. l* has to be increased.
It has already shown to be very efficient to solve highly difficult problems, both academic and real, such as • optimal control of chemical process • optimal structure of molecules (GRBS 94, 97) • chemical multiphase equilibrium (NGL 2001 a & b) • polimer reactors (D 2003) It does not find local minima with larger objective function than the best founded so far f(x*). This characteristic makes it faster than other global methods like Simulated annealing (NGL 2001) Genetic algorithms (GCSQ 2001)
Tunneling in parallel • After a local minimum x* has been found, start the tunneling search from a point in the neighborhood of x* x = x* +r r = random direction Sequential :if the search is unsuccesful, start again from another initial point x Parallel: start the search in parallel in random directions (GCCS 2002)
Why LM-Quasi Newton vs T-Gauss-Newton • Our least squares problem could be highly non-linear ( there is an inverse operator in f ) • LM Quasi-Newton approximates the inverse of the complete Hessian • T Gauss-Newton uses the approximation with J given by the simulator. We test if this approximation works for our problem
Limited Memory Quasi-Newton: with Linear search Stopping Conditions: Truncated Gauss-Newton: with Trust region (TRON) Stopping Conditions:
Another reason to use Truncated Gauss-Newton To find the descent direction s , solve the linear system: using the Conjugate Gradient method Stopping the CG iteration before the error in the matrix and in the right hand side propagates, has a regularisation effect. To know when to stop, we use our algorithm to find the corner of the L-curve automatically (CGG 2002). The Trust region size is modified accordingly. TRON has the option to precondition with Incomplete Cholesky
Scaling Characteristic of the History Matching problem: Very flat valleys • When an ill-posed problem is discretised, the resulting Hessians are ill-conditioned Scaling to make valleys sharper GSCQ 2001
Scaling If the original bounds are in then a new variable y will be in where D is a diagonal matrix with elements and c is a vector with • The function in y is not altered h(y) = f(x), but the gradient and the Hessian
Scaling This implies that the Truncated Gauss-Newton linear system is preconditioned • Other traditional preconditioners like ICC may not work: the singular values of the Hessians decay to zero.
The PUNQ problem is a benchmark for History Matching and risk-analysis methodologies. • It is a dynamical reservoir model based on a real West Africa field, which has been discretised using a 19x28x5 corner-point grid, with 1,721 active cells. The PUNQ Test Case • A history period, simulating 8 years of production from six wells located close to the gas-oil contact (GOC), was generated by using geostatistical distributions of porosities and permeabilities. • Gaussian noise has been added to the collected well data to reproduce a real measurement process. • Then, 8 years of forecast with five additional infilling wells have been simulated.
The PUNQ Test Case • The choice of history matching parameters are pore volume, and horizontal transmissibility multipliers. • The complexity of the H-M identification problem was avoided by adopting a set of parameters, based on the Gradzone (sensitivity) Analysis (GRC-UK), in which he available a-priori geological information was included. • This analysis leads to 30 history matching parameters, which contains a signature of the geological model. We also use a set of 10 history matching parameters, 5 and 5 : one multiplier for each property was assigned to every layer.
The PUNQ Test Case A multiplier parameter means that although the gridcells in one zone can have a different pore volume, their values relative to each other remain constant. This way to parameterize the problem is a source of uncertainty. To restrict the evolution of the system into a physically reasonable region, simple bounds, acting as perfectly absorbing surfaces, are imposed to the parameters :
Original results on a simpler synthetic case without data-error Phase Min1 Tun1 Min2 Tun2 Min3 Tun3 Min4 Tun4 Min5 f* 0.0936 0.0887 0.0867 0.0742 0.0046 0.0045 0.0035 0.0010 0.0009 fn-ev 107 36 44 76 65 178 34 128 32 x* 1.011 0.986 1.0134 0.115 1.366 0.998 1.002 1.0820 0.097 0.763 0.991 1.001 1.0800 1.024 0.752 1.004 0.995 0.9280 0.797 1.076 1.007 0.991 0.9560 0.931 1.201 fmax 6 E+3 1 E+4 5 E+2 7 E+2 Total cost 600 / 600 fn / grad
PUNQ-10 without noiseinitial point = ip x* = (1, 1, ..., 1) Method # Min fun / grad f * frtol Tun-TGN no-prec 2 30 / 21 0.00002 0.5x10⁻³ Tun-TGN prec 1 14 / 10 0.0000005 Tun-LBFGSB 5 166 / 166 0.0020 2.2x10⁻³ Tun-LBFGSB 2 229 / 229 0.0001 2.2x10⁻⁶ No-error, the global min (zero residual) gives the best approximation
PUNQ-10 without noiseinitial point = ub x* = (1, 1, ..., 1) Method # Min fun / grad f * frtol Tun-TGN no-prec 1 23 / 23 0.00005 0.5x10⁻³ Tun-TGN prec 1 27 / 19 0.00005 Tun-LBFGSB 10 408 / 408 0.00217 2.2x10⁻³ Tun-LBFGSB 4 483 / 483 0.0001 2.2x10⁻⁶
PUNQ-10 with noiseinitial point = (1, 1, ..., 1) x* = ? Method # Min fun/grad f * frtol Tun-TGN+noprec+ no-sca 4 211 / 105 0.309 0.5x10⁻³ Tun-TGN+ prec + no-sca 6 493 / 302 0.329 “ Tun-TGN+noprec+ sca[1, 2] 9 440 / 281 0.295 “ Tun-TGN+ prec+ sca[1,2] 2 248 / 160 0.315 “ Tun-TGN+noprec+ sca [0.7,1.3] 5 278 / 170 0.288 “ Tun-TGN+ prec+ sca [0.7,1.3] 3 387 / 236 0.317 “ Tun-LBFGSB 7 873 / 873 0.343 2.2x10⁻³ Tun-LBFGSB 7 599 / 599 0.317 2.2x10⁻⁶
Not-scaled Scaled [0.7, 1.3]
The best minimum ? • WCT is the most sensitive (to error propagation?, to the formulation?): an intermediate minimum gives the best approx. • GOR the least sensitive
Extreme Cases Perfect cases : GOR Pro1, Pro11, Pro12 The only bad case
Forecast for the Field PropertiesFWPT: Field Total Water Production
The error between the real case and the calculated forecast for the 5 minima found. The error has been calculated on 6 field properties FOPT, FGPT, FWPT, FGOR, FGPR, FWCT FOPT FGPT FWPT FGOR FGPR FWCT ERROR Min1 6.241 6.655 7.449 6.679 6.275 6.265 6.594 Min2 8.620 7.716 11.150 8.476 7.085 7.645 8.449 Min3 8.226 7.790 10.356 8.957 7.589 8.294 8.535 Min4 8.483 9.140 9.652 9.071 9.152 8.577 9.013 Min5 5.202 5.016 6.157 5.573 4.830 5.315 5.349
Global Optimisation as a regularisation strategy ? • The degree of approximation ( a local minimum with good match to the data and forecast ), would be the regularisation parameter. • Then, if the data-error 0, (zero-residual) • If there is no error in the data, the global minimum is the zero-residual exact fit and gives the best approximation • If there is error, an intermediate minimum gives the best possible approximation (H-M & Forecast)
Conclusions • The Tunneling Method + TGN has proven to be capable of finding improved solutions • Tunnel-TGN is much faster than Tunnel-Lbfgsb: The number of function evaluations can be reduced up to 4 times, and gradient evaluations up to 6 times. • Tunnel-TGN method, is attracted to the global minimum when there is no-noise in the data, from some starting points, whereas Tunnel-Lbfgsb is attracted to several local minima, from every starting point.