Failure of Materials
450 likes | 753 Views
Failure of Materials. BADI Year 1 John Errington MSc. F. F. A 0. A 0. l 0. l 0. l. l. F. F. Axial forces. Stress, = F/A 0 Strain, = (l 0 - l i )/l 0 = l/l 0 where l i is the instantaneous length. Strain can be negative – usually for compressive loads.

Failure of Materials
E N D
Presentation Transcript
Failure of Materials BADI Year 1 John Errington MSc
F F A0 A0 l0 l0 l l F F Axial forces Stress, = F/A0 Strain, = (l0 - li)/l0 = l/l0 where li is the instantaneous length. Strain can be negative – usually for compressive loads Tension Compression
radius 3/8 in. diameter, 0.75 in. diameter, 0.5 in. gauge length, 2 in. reduced section, 2.25 in. Measuring stress/strain • A standardised sample of the material is placed in a machine that applies an axial force • an extensometer is used to measure the extension • Sample should be long & thin, with no sharp corners that would act as stress concentrators (more later)
A0 F F Shear modulus • We have seen that tension / compression stress and strain are linearly related at low stresses (Hooke’s Law) • Y = σ / εwhereY=Young’s modulus, σ =stress, ε = strain • Similarly, shear stress and strain are linearly related at low stresses • = G, where G is the shear modulus Shear stress, = F/A0 Shear strain, = tan
T T Torsion Torsion = T/A0 Shear strain, = tan
l0x lx/2 lz/2 l0z Poisson’s ratio • When an object is under tensile stress, it usually gets longer and thinner • hence, there is a negative strain in the direction perpendicular to the applied stress since the two strains are always of opposite sign, Poisson’s ratio is always positive
If the material is isotropic, the shear and elastic moduli are related by E = 2G(1 + ) which gives G ≈ 0.4E for most metals Many materials, especially crystals, are definitely not isotropic, so their properties depend on the crystal directions. In such non-isotropic materials, almost all physical properties (E, G, resistivity ...) are direction-dependent, so ‘constants’ become matrices – called tensors. Timber is a good example of an anisotropic structural material.
stress tensile strength ultimate strength upper yield point lower yield point sy material creeps (extension without increased stress) or sample ‘necks’ failure material may follow either path elastic region plastic region strain yield elongation ultimate elongation Typical stress-strain curves www.matcoinc.com/images/sem1a.jpg
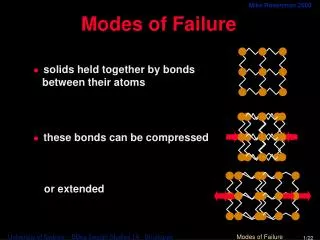
What’s happening? • Elastic deformation is straightforward to visualise microscopically • the bonds between atoms stretch or compress a bit and return to normal when the load is removed • But what is happening during plastic deformation? • on one hand, the deformation is permanent so something serious has taken place • on the other hand, the material is still intact, so some bonds must still be functional • or at least broken and then re-formed • This is related to dislocations in a crystal, and wasn’t really understood until electron microscopes were able to reveal dislocations directly
Role of dislocations • Dislocations in a material provide a mechanism by which large numbers of atomic bonds can be broken and re-formed • the theoretical strength of ideal, dislocation-free materials is much higher than that measured in practice • also, the preparation and treatment of the material significantly influenced the measured strength • There are two main types of dislocation • edge dislocation • screw dislocation
Edge dislocation • Under an applied stress, the edge dislocation can move in the direction of the stress unit step of slip slip plane shear stress • This process, leading to elastic deformation, is called slip
Screw dislocation • The screw dislocation itself moves perpendicular to the stress direction, but the deformation ends up the same http://www.uet.edu.pk/dmems/ScrewDislocation.gif
Slip systems • In crystalline materials, the anisotropy of the structure can mean that certain slip directions are preferred • termed slip planes • and these move in slip directions • Together slip planes and directions are called slip systems, • and these slip systems act to minimise the overall atomic distortion caused by the motion of the dislocation • It follows from the above that the slip planes are those planes in the crystal which have the highest packing density of atoms • by keeping these densely packed atoms together, fewer bonds are distorted
The number of slip systems depends on the crystal structure each slip system for BCC (body centred cubic) and FCC (face centred cubic) has at least 12 slip directions. while the maximum for HCP (hexagonal close packed) is 6. Hence FCC (Cu, Al, Ni, Ag, Au) and BCC (Fe) metals tend to be ductile and exhibit large plastic deformation, while HCP (Ti, Zn) are more brittle. Slip in crystal structures (111) plane of a FCC material, showing three <110> slip directions Face centred cubic crystal structure
single crystal zinc from Callister Hexagonal close packed crystal structure.
How many dislocations? • Unless specially prepared, all materials contain dislocations • due to deformation or during solidification • Dislocation density is the total length of dislocations per unit volume • best achievable in metals ~103 mm-2 • heavily deformed metal ~ 1010 mm-2
Polycrystalline materials • When plastic deformation occurs in polycrystalline metals – i.e. in ‘normal’ metals – grain boundaries stay intact but the grains change shape by slip • e.g. in a steel rolling mill, grains are aligned to the roll direction • properties (incl. magnetic) may be different parallel and perpendicular to the direction of roll from Callister before deformation after deformation
Strengthening of materials • Now that we understand a little about why materials deform, how can we make them stronger? • Since deformation arises from the mobility of dislocations we expect that anything that reduces the motion of dislocations will strengthen the material • Essentially, we can do three things • reduce the size of crystal grains • add impurity atoms • strain hardening
grain boundary Grain size reduction • At a grain boundary, the crystal orientation changes • hence it is difficult for a dislocation arriving at the boundary to continue into the adjacent grain • moreover, there is a certain atomic randomness associated with the region between grains, which also makes it harder for the dislocation to propagate
For moderate grain sizes, the Hall-Petch relationship holds for the yield strength, sy where d is the average grain diameter, and k0 and s0 are constants for the material • In practice, the grain size can be determined by the rate of cooling of the solid from the melt
60 400 elongation (% of 2in.) tensile strength (MPa) 40 300 20 200 10wt% Ni in Cu 50wt% Ni in Cu Solid solution strengthening One of the oldest-known and most straightforward way to increase the strength of a metal is to add impurities to make a solid solution or alloy • Interstitially, i.e. in between atoms in structure, or • Substitutionally, replacing one kind of atom with another
small impurity atom gives tensile strain large impurity atom gives compressive strain impurity hinders edge dislocation movement • The addition of a ‘foreign’ atom locally strains the surrounding material • making it harder for the dislocation to propagate • almost like a mini-grain boundary
Strain hardening • Strain hardening is the process whereby a material becomes stronger as plastic deformation takes place • it is also called work hardening or cold working • the effect is well known by machinists because it makes the material harder to machine even as you do so – stainless steel is a notorious example • After strain hardening, the material is more brittle • The mechanism is that more dislocations are formed as the metal is plastically deformed and hence the movement of dislocations is more difficult and the material hardens
Failure mechanisms • Clearly, it is important to know how materials fail mechanically • e.g. the “Liberty” ships mass produced to convey supplies to Britain during WWII • it turned out that in the low temperatures of a North Atlantic winter steel became brittle (Constance Tipper, Cambridge University, UK) http://www-g.eng.cam.ac.uk/125/noflash/1925-1950/images/tipper_libertybreak.jpg
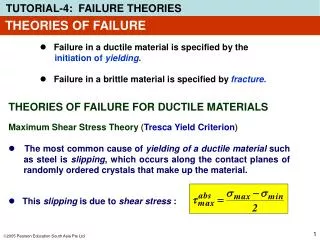
Fracture • Fracture occurs when a material under a load breaks into parts at temperatures much less than the melting temperature of the material • While the stress can be shear, torsion or axial, we will talk about only the latter in any detail • Essentially two types of fracture interest us • ductile • brittle • Ductile failure only occurs after significant plastic deformation • and, unlike brittle fracture, gives some warning that failure is about to occur!
crack propagates by repeated cycles – fatigue final failure is brittle http://www.resnapshot.com/MP1198-2.jpg • Typically, any fracture process involves both crack formation and crack propagation • in ductile materials the crack will often not propagate unless additional stress is applied – a stable crack • the mechanical energy is absorbed by the deformation • brittle materials fail suddenly and with a large release of mechanical energy – cracks are unstable
rough surface from plastic deformation characteristiccup-and-coneshape of ductilefracture initialnecking crack propagation(in shear) cavityformation cavitycoalescence Ductile failure http://web.umr.edu/~be120/lessons/intro/tension/testing_st/fracture.gif
Brittle fracture • Brittle fracture takes place with little prior deformation • and the surfaces tend to be flatter and perpendicular to the stress • Typically crack propagation is by successive breaking of bonds along a particular crystalline direction – cleavage • in a polycrystalline material, the crack may propagate along grain boundaries – intergranular http://www.jwave.vt.edu/crcd/farkas/lectures/Fract1/fig3.gif
Stress concentration • The key to understanding fracture mechanics is the concept of stress concentration • at a sharp corner – such as the tip of a crack – a local enhancement (or concentration) of stress occurs • i.e. the local stress is significantly higher than the average applied stress • hence the material fails at a lower stress than otherwise predicted • (a little like a lightning conductor) • And all materials contain cracks, surface scratches etc.
If, to keep the math simple, we assume an elliptical crack, the stress is given by • where ρt is the radius of the crack tip and a is half the length of the ellipse axis Callister
Crack propagation • If the crack is long and sharp, the stress at the tip can be many times the applied stress • The effect depends on whether the material is ductile or brittle • a ductile material will deform plastically, which serves to increase the tip radius and decrease the stress – assisting the formation of stable cracks. • brittle materials feel the full effect of the concentration • Griffith developed a simple model to derive the critical stress required for a crack to propagate in a brittle material …
Griffith model • When the crack tip moves, some material that was strained becomes relaxed • hence strain energy is released as the crack moves • However, it takes energy to break the bonds and to thereby move the crack • Griffith assumed that the crack would propagate only if it was energetically favourable for it to do so • i.e. the energy released by the crack growth was at least equal to that taken to cause the growth • For an elliptical crack, the critical stress is
Mystery failures - de Havilland Comet • G-ALYY was leased from B.O.A.C. to South African Airways. Flight SA201 was on its way from London to Johannesburg. After a fuel stop in Rome the plane took-off, but only 36 minutes later the radio-contact was interrupted in the area of Stromboli. January 1954. • The next morning remains were found in the sea. Since the sea was at this place as deep as 1000 meters, no parts of the aircraft could be inspected. Only four days after the crash the Comet flights were again suspended, one of the reasons being the similarities to the YP crash. G-ALYY had only performed 2704 flighthours. A very intensive flight test program was performed in order to find out the reason of the YY and YP crashes, with no special conclusion. • Only after a very long expensive investigations, which included the assembly of the remains of the crashed YP and the underwater stress test of the YU Comet which came from B.O.A.C. Finally the fuselage of YU broke up on a sharp edge of the forward escape-hatch. After that this rupture was repaired the tests were restarted, but only shortly afterwards the fuselage broke up. This time the rupture started at the upper edge of a window and was three meters long. • The YP and YY crashes were due to metal fatigue, which took place because of the crystalline changes in the fuselage skin. They were amplified by the high speed and altitude the Comets were operated. The metal fatigue resulted in ruptures of the fuselage, this had as a consequence a terrible decompression at 33Kft, tearing up the plane with all known consequences. http://www.geocities.com/CapeCanaveral/Lab/8803/comet.htm http://www.baaa-acro.com/Photos-2/G-ALYP.jpg
Fatigue • It is estimated that 90% of material failure is due to fatigue • repeated load/unload cycles in which the maximum stress is well below the strength of the material • often involves sharp corners – e.g. Comet escape hatch • Fatigue failure appears brittle-like even in ductile materials • and is caused by the repeated formation of small cracks • Fatigue is characterised by the S-N curve • plotting S, the stress amplitude (sa) of the load cycle, versus N, the number of cycles to failure
stress amplitude stress amplitude e.g. Fe, Ti e.g. Al, Cu fatigue limit 103 105 107 103 105 107 109 109 cycles to failure (log scale) cycles to failure (log scale) S-N curve • There are two general types of S-N curve
Some materials reach a fatigue limit (at 35% to 65% of tensile strength) below which fatigue failure will not occur regardless of the number of cycles • Others will fail at some N, regardless of the stress amplitude – e.g. Al • Fatigue strength • the stress level at which failure occurs after a specified number of cycles • Fatigue life • number of cycles to failure at a particular stress amplitude
Summary • In this chapter we began by looking at fundamental concepts of stress and strain • Which led to Hooke’s law, Young’s modulus, Poisson’s ratio, etc. for elastic deformation • We also considered plastic deformation and the stress-strain diagram • From this macroscopic view, we then explored the underlying microscopic mechanisms, and how to strengthen materials • Finally, we discussed failure mechanisms in metals