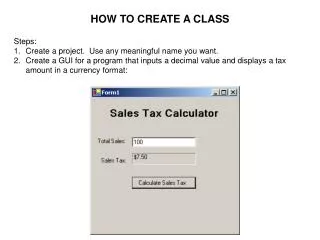
How to Create and Customize a Seating Chart for Various Arrangements
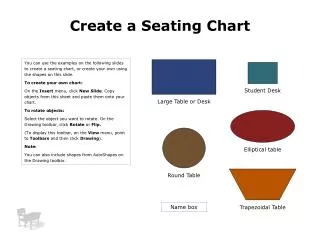
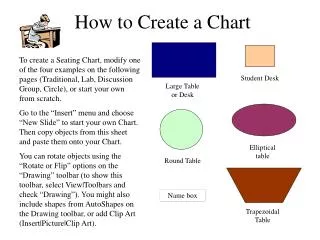
Learn how to create a seating chart using PowerPoint by modifying existing templates or designing your own. Choose from four examples: Traditional, Lab, Discussion Group, or Circle, or start from scratch. Begin by inserting a new slide and pasting objects to your chart. Utilize the “Rotate or Flip” options in the Drawing toolbar for adjustments. Enhance your design with AutoShapes or Clip Art to represent student desks, tables, and name boxes, ensuring a tailored setup for any learning environment.

How to Create and Customize a Seating Chart for Various Arrangements
E N D
Presentation Transcript
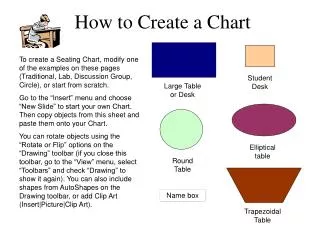
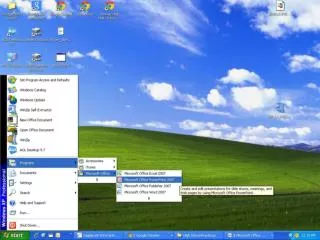
How to Create a Chart To create a Seating Chart, modify one of the four examples on the following pages (Traditional, Lab, Discussion Group, Circle), or start your own from scratch. Go to the “Insert” menu and choose “New Slide” to start your own Chart. Then copy objects from this sheet and paste them onto your Chart. You can rotate objects using the “Rotate or Flip” options on the “Drawing” toolbar (to show this toolbar, select View|Toolbars and check “Drawing”). You might also include shapes from AutoShapes on the Drawing toolbar, or add Clip Art (Insert|Picture|Clip Art). Student Desk Large Table or Desk Elliptical table Round Table Name box Trapezoidal Table
Traditional Name box Name box Name box Name box Name box Name box Name box Name box Name box Name box Name box Name box Name box Name box Name box Name box Name box Name box Name box Name box Name box
Discussion Group Name box Name box Name box Name box Name box Name box Name box Name box Name box Name box Name box Name box Name box
Lab Tables Name box Name box Name box Name box Name box Name box Name box Name box Name box Name box Name box Name box Name box Name box Name box Name box Name box Name box Name box Name box Name box Name box Name box Name box
Circle Name box Name box Name box Name box Name box Name box Name box Name box Name box Name box Name box Name box