Download
1 / 32
320 likes | 556 Views
Creating the Project Plan. The Plan versus a Schedule. The plan Defines the activities Documents the interaction between activities Estimates the duration for completing each activity Analyzes the sequences, duration and resource requirements to crate a project schedule The schedule

E N D
The Plan versus a Schedule • The plan • Defines the activities • Documents the interaction between activities • Estimates the duration for completing each activity • Analyzes the sequences, duration and resource requirements to crate a project schedule • The schedule • Determine start and finish dates for project activities • Often must be iterated(along with processes that are the input) especially the duration estimating
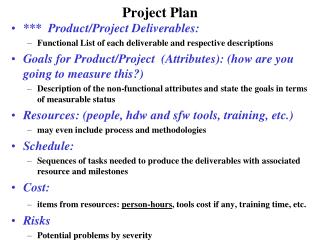
Project Planning Techniques • Provide regular status updates to stakeholders • Include team members in planning sessions and plan preparation • Provide various alternatives to management • Scope constrained alternatives • Time constrained alternatives • Resources alternatives • Plan to plan • Obtain plan approval before beginning execution
Work Products for Planning Task List Work Breakdown Structure Project Objectives Precedence Graph CPM Diagram Gantt Chart
Getting the Planning Process Started Optional: for a product-oriented project, it may be useful to begin with a product list Product List Task List Work Breakdown Structure Project Objectives • Planning depends on estimates of the work required and the way it will be organized. • The planning process is driven by the project objectives
From Task List to WBS Task List Task ATask BTask CTask DTask ETask F WBS Overall Task SubTask 1 SubTask 2 Task B Task C Task A SubTask 2.1 Task F Task E Task D add management
WBS as an Estimation ToolBottom-Up Estimating • Effort for smaller tasks can be more accurately estimated than larger ones • Estimate all the “primitive” tasks first (those at the bottom of the WBS – with no subtasks of their own). PMBOK * calls these work packages. • Combine these estimates to get an overall estimate or estimates for major subtasks • Track actuals against estimates at the task level to improve your estimating skills • Use this data to create a useful experiential estimation database Project Management Book of Knowledge
Precedence Graph • The precedence graph captures predecessor or sequencing information for all tasks in the WBS • Used as an intermediate step toward a CPM diagram • The process used to create the precedence graph is referred to as PDM (Precedence Diagram Method) in the PMBOK. Work Breakdown Structure Precedence Graph
Precedence Graph Activity P Activity M Activity O Activity Q Activity S Activity N Activity R Activity N must complete before Activity R can begin, and so on.
Effort and Duration • CPM (Critical Path Method) Diagrams are derived from Precedence Graphs • To accomplish this, we must translate effort estimates into duration estimates • Effort defines the total required number of time units (often measured in hours) to complete a task • Duration refers to the calendar time (often in days or weeks) required to complete task
Effort and Duration (cont’d) • Effort is distributed over a duration • This is done by assigning some particular number of persons to the task at various times • Or, we can assign percentages of one or more persons’ time to the task at various times
Effort, Duration, and Resource Allocation • For example, a 750 hour effort would have a 10-week duration if 2 persons were allocated to it fulltime (assuming a fulltime week = 37.5 hours) for that period • However, this same effort could result in drastically different durations, with different resource allocations: • 40 weeks – if 50% of a person’s time is allocated to it • 20 weeks -- if 1 person is allocated to it fulltime • 15 weeks -- with1 person fulltime for 10 weeks, then 2 persons fulltime for the next 5 weeks • 5 weeks – with 4 persons allocated to it fulltime
Effort, Duration, and Resource Allocation (cont’d) It is important to remember that the required effort is just one factor that goes into making a duration estimate. We’ve all heard it: If one woman can produce a baby in 9 months, how soon can 9 women produce a baby?
Effort, Duration, and Float (Slack) • If we allocate resources so that a task is completed before it is absolutely necessary for all the other task(s) waiting for it to complete, we say that we have built float or slack time into our schedule • Float adds flexibility to a project’s schedule and hence it is important to recognize when it is possible • The Critical Path Method (CPM) Diagram captures this feature of a project
CPM Diagrams “The Critical Path Method (CPM) is a network analysis technique used to predict project duration by analyzing which sequence of activities (which path) has the least amount of scheduling flexibility (the least amount of float). Early dates are calculated by means of a forward pass, using the specified start date. Late dates are calculated using a backward pass, starting from a specified completion date – usually the forward pass calculated project early finish date.” According to the PMBOK: PMBOK View
Adding More Information to the Precedence Graph – CPM Diagrams Earliest Start Earliest Finish Task Duration Float Latest Start Latest Finish Precedence Graph Add this information for each node in the Precedence Graph CPM Diagram
Terms for CPM Diagrams • D = Estimated Duration • ES = Early Start Date ES = Earliest finish time for all preceding events • EF =Early Finish Date EF = ES + D • LF =Late Finish Date LF = Latest start time of all succeeding events • LS =Late Start Date LS = LF - D • F = Float F = LF - EF OR F = LS - ES • F = The time an activity’s start or finish can be delayed without delaying project completion For each node:
Computing Terms for CPM Diagram Nodes • D is an estimate (must be known) • Determine ES = Early Start ES = Earliest finish time for all preceding events • Determine LF =Late Finish LF = Latest start time of all succeeding events • Then we compute LS, EF, and F
CPM Diagram Nodes -- Example early start (determined by earliest finish for all preceding activities) early finish (= 4 + 3) 4 weeks 7 weeks 2 Task 3 weeks 2 weeks 1 duration float (= 9 – 7 or = 6 – 4) 6 weeks 9 weeks 3 late finish (determined by the latest start for all succeeding activities) late start (= 9 – 3) Add this type of information for each node
Method for Computing CPM Diagrams • All activities must be assigned durations before you begin • Start with the activities that have no preceding activities and assign their early start times to be 0 (there may be only one of these) • Work from left to right and compute the early start and early finish times for all nodes – this is called the forward pass • The largest early finish time will determine the minimum time for the project to complete • All activities with no succeeding activities will get this value as their latest finish times (there may be only one of these). Assign each of these activities to have 0 float • Use this information to work from right to left assigning late finish times and late start times for all nodes – this is called the backward pass • Now you can quickly compute float for all nodes
Team Activity 1: CPM Diagram Consider the CPM Diagram (partial) given on the next slide Complete the diagram by determining the missing information for each node.
Critical Paths • If an activity that has 0 float slips, the entire project will slip by that amount • This is why activities that have 0 float are said to be on a critical path • There may be multiple critical paths for a project • Many practitioners establish some threshold amount of float (suitably small) and compute near-critical paths as well
Critical Paths (cont’d) • Note that critical (and near-critical) paths are dynamic and change as the actual (as opposed to estimated) schedule unfolds • Critical (and near-critical) paths must be recomputed each time there is an activity slippage anywhere in the schedule that is larger than that activity’s float
Why Compute Critical Paths? • Can be used to focus resources and attention more efficiently and effectively • Best resources can be assigned to critical path activities • Allows project manager to monitor crucial activities more closely • Helps prioritize risks, so risk mitigation activities can be focused on the most important potential risk events • “Near-critical” tasks can also be identified and tracked
Why Compute Critical Paths? (cont’d) • Schedule “emergencies” can be addressed by “crashing” or fast-tracking critical path activities • Crashing means compressing activity duration • Fast-tracking means doing things in parallel • Danger in crashing or fast-tracking is increased risk
Team Activity 2: Critical Paths Consider the CPM Diagram you completed in the previous activity. • What is the shortest possible duration for the project? • Identify the critical path (or paths). Consider questions 3 and 4 independently of each other. • If Procurement slips 3 weeks, what is the impact on the project duration? What happens to the critical path • If Beta Test slips 2 weeks (with no other slippage), what is the impact on the project duration?
Team Activity #3 • A project has been defined to contain the following list of activities along with their required times for completion • Draw a CPM diagram for the activities • Calculate the earliest completion time • Show the critical path • What would happen if activity 6 were revised to take 6 weeks instead of 1 week
Team Activity #4 • Look at the activities outlined in Team Activity 3 (see below). Assume that your team is in its first week of the project and has discovered that each of the activity duration estimates is wrong. Activity 2 will take only 2 weeks to complete . Activity 4 and 7 will each take three times longer than anticipated. All other activities will take twice as long to complete. In addition a new activity, number 11- Feedback, has been added. It will take 1 week to complete and its immediate predecessors are activities 10 and 9. • Adjust the CPM diagram and • Recalculate the earliest expected completion time
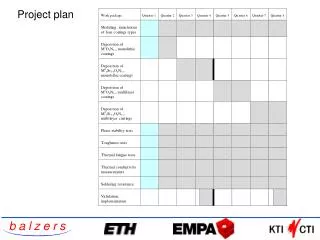
Gantt Charts • Created from CPM diagrams • Capture scheduling information in a bar chart format • Dynamic Gantt charts (that is, those that are updated frequently) are an excellent tool to ascertain the status of a project at a given time • Good tool for estimating resource needs in a given time frame CPM Diagram Gantt Chart
Gantt Charts – An Example date (week #) 1 2 3 4 5 6 7 8 tasks T1 T2 T3 T4 T5 critical path float
Team Activity #5: Gantt Chart • Create a Gantt chart from your CPM Diagram. • What kind of resources do you anticipate needing in week 6? • Can you tell how many resources you will need of each type/category? Hint: Are duration and effort the same? Construct a Gantt chart for your CPM diagram created in Activity 3