Download
1 / 1
10 likes | 107 Views
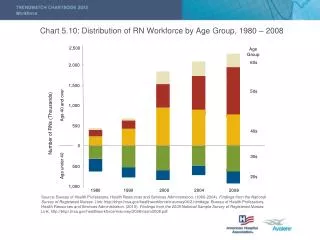
Explore the historical trends in the distribution of registered nurses by age groups from 1980 to 2008. Discover how the RN workforce has evolved over the decades.

E N D
Chart 5.10: Distribution of RN Workforce by Age Group, 1980 – 2008 Age Group 2,500 60s 2,000 1,500 50s Age 40 and over 1,000 Number of RNs (Thousands) 500 40s 0 30s Age under 40 500 20s 1,000 1980 1990 2000 2004 2008 Source: Bureau of Health Professions, Health Resources and Services Administration. (1980-2004). Findings from the National Survey of Registered Nurses. Link: http://bhpr.hrsa.gov/healthworkforce/rnsurvey04/2.htm#age. Bureau of Health Professions, Health Resources and Services Administration. (2010). Findings from the 2008 National Sample Survey of Registered Nurses. Link: http://bhpr.hrsa.gov/healthworkforce/rnsurvey/2008/nssrn2008.pdf.