Download
1 / 40
400 likes | 590 Views
Technical Audit Methods and Results for Anemometers Used in the Missouri Ambient Air Monitoring Networks. Stephen M. Hall Missouri Department of Natural Resources Air Quality Assurance Unit. Introduction.

E N D
Technical Audit Methods and Results for Anemometers Used in the Missouri Ambient Air Monitoring Networks Stephen M. Hall Missouri Department of Natural Resources Air Quality Assurance Unit
Introduction Wind speed and wind direction meteorological data are monitored at many ambient air monitoring sites in Missouri. Of the two quantities, wind direction has shown to be the most inaccurate. This presentation identifies an interpretation of the EPA wind direction data accuracy criteria and presents a method that was used to collect independent audit data. This data was analyzed to determine anemometer orientation accuracy.
Outline EPA Wind Direction Accuracy Criteria (an interpretation) Audit Method Development Audit Equipment Utilized Audit Results Audit Equipment Precision & Accuracy Closing Points Recommendations
EPA Wind Direction Criteria Wind Direction Accuracy: 5 Degrees total “System error” (orientation error + sensor index error) 3 degrees relative to the Anemometer’s (sensor) mount or index ( 5 Degrees absolute error for installed systems)
Interpretation of EPA Wind Direction Criteria for Technical Auditing Absolute Error of Anemometer’s (sensor) alignment notch (index) from True North • 2 degrees acceptable for orientation error. The trick is to determine what is required to measure and verify that alignments are within 2 degrees of True North. Allows vane angle response errors to be 3 degrees and the total system error will remain within 5 degrees.
Combined Index and Orientation Error - Graphical Description Orientation Error (+/-) Anemometer Alignment Notch (index) (its physical orientation) True North Vane Angle Response error +/- (relative to Notch)
Audit Method for Orientation Measure location of alignment notch with a precision compass (resolution +/- 0.5 degrees, Accuracy 0.25 degrees). Determine True North by compensating for the site’s magnetic declination. Find the difference between True North and the anemometer’s orientation. This difference is the absolute error from True North which is independent of the Anemometer’s response relative to its alignment notch.
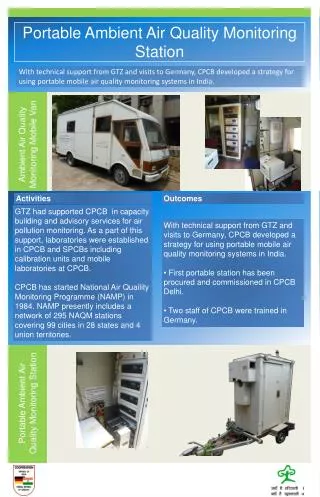
Variety of Anemometer Installations 21- RM Young Model 05103 or 05305-(AQ model) (integral Vane & Prop) (there were only 2 of the 21 that were the AQ model) 5- Mesa Systems Co. (Ultrasonic) 1- Climatronics (separate cup and Vane) Due to the overwhelming majority of the RM-young Anemometers, we developed the audit protocol specifically for these units.
Variety of Tower Installations 10 meter towers (fold down or telescoping) 6 meter “towers” (pole installations on top of sampling shelters) Note: Only about 10 of the 27 sites have anemometers mounted on towers 10 meters above ground level.
Orientation Audit Equipment Due to the variety of Anemometer installations a “flexible” audit orientation apparatus was constructed
Orientation Audit Results The following orientation audit data represent audit results from all 25 of the Network’s unique metrology sites which consist of the RM-Young installation. The sign of the difference was arbitrarily defined as follows: (+) measured orientation “leads” True North (–) measured orientation “lags” True North
Anemometer Vane Angle Response Error Relative to Alignment Notch (index) Determines the error of the anemometer’s degree response relative to the alignment notch (index)
Alignment Notch Interface Alignment Notch Interfaced with bench notch (index) Align notch here, and you have made a 60 degree mistake! -Be CAREFUL-
Vane Angle Response Audit Results 25 of the network’s sites consisting of the RM-Young models were audited over a 3 year period. The audit data represent all paired differences (550 total differences) over the following discreet audit points: 0, 30, 60, 90, 150, 180, 230, 270, 330, and 350 degrees.
Total System Error “As Found” The following histogram shows the combined effect of the orientation and vane angle response error with the anemometer in its “as found condition”.
Total System Error “Adjusted” The following histogram shows the combined effect of the orientation and vane angle response error on “Total System Error” AFTER the anemometer’s alignment notch was aligned to True North.
Audit Equipment Precision & Accuracy The accuracy of the audit equipment is determined by the manufacture’s published specifications. • Vane angle response bench • Orientation apparatus We gathered data to check the repeatability of the following Audit equipment:
Vane Angle Response Bench • Blind repeatability test- Verified the precision of our vane angle response bench with two setups and the same anemometer. Maximum error for any repeated setting was within 0.24 degrees.
Orientation Equipment Anecdotal evidence suggests repeatability will be well within one degree.
Comparing Two Sources of Declination Data Aeronautical Chart , US DOT & FAA April 18, 2002 NOAA Site: http://www.ngdc.noaa.gov/seg/geomag/jsp/IGRF.jsp for April 18, 2002
Closing Points • Orientation error is the greatest contributor to the inaccuracy of wind metrology data. Vane angle response errors are the greatest contributors to anemometer performance audit failure. Infrequent quality control checks correlate with anemometer performance audit failure.
Recommendations Magnetic Interference must be carefully considered when developing and implementing audit protocol for the orientation accuracy. Keep in mind that you may need to address this issue on a site specific basis. When developing vane angle response criteria, establish audit points that monitor anemometer performance at both limits of the of potentiometer “Dead Zone”.
Recommendations Monitoring agencies should establish routine quality control checks of the anemometer’s bench performance at least once every six months. Agencies that have independent auditing could reduce quality control checks to once per year with audits performed once per year and, preferably, 6 months out of phase with the QC check.
Recommendations Chose a particular source for the network’s declination estimate and use it consistently when performing orientations.