Download
1 / 32
320 likes | 511 Views
National Ambient Air Monitoring Networks. Now and Later. PM model evaluation workshop. Also troubling is the delineated use of measurements and modeled predictions. …..Measurements are the current tool for strict regulatory applications, and models are used as a planning tool.

E N D
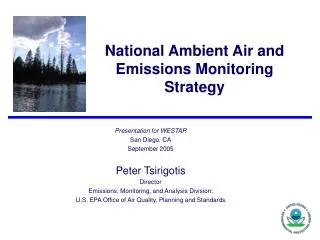
National Ambient Air Monitoring Networks Now and Later PM model evaluation workshop
Also troubling is the delineated use of measurements and modeled predictions. …..Measurements are the current tool for strict regulatory applications, and models are used as a planning tool. ………The reality is that measurements really are just estimates of surrounding reality, and in one sense no different from a predictive output from a model. ……. Both these tools need to be more effectively merged to support in unity a host of regulatory and planning applications.
Topics • Current networks…routine • Anticipated changes • Overview of incommensurability and artifact issues • Supersites
National Level Routine Networks…S/L/T’s, EPA • PM2.5: FRM, cont., spec (trends (daily), SIP, IMPROVE, SS); >1000 sites • PM10 >1000 sites • O3 > 1000 sites • NOx/NO (NO2) > 400 • SO2 > 400 • CO > 400 • Pb > 400 • O3 precursors, PAMS >70 sites • S, N deposition, CASTNET, > 50 sites
2000-2002 3-Year Average Annual Mean PM2.5 Data from AQS 7/9/03. Sites that operated anytime 2000-2002 (n=1239)
Urban and Rural PM2.5 Speciation Networks Active Sites as of 1/20/04: EPA data from AQS, IMPROVE data from VIEWS
Supersites IRD Study Domain Southeastern Canada New York Pittsburgh Baltimore Fresno St. Louis Los Angeles Atlanta Houston Phase I Phase II Both Phases
8 SS ~ 54 Trends ~175 SIPs ~150 IMPROVE Routine Speciation ~ 1050 FRMs ~ 200 cont. Mass Sampling PM2.5 Networks
Areas with PAMS Networks • PAMS areas • Type #2 site • Type #1, #3, #4 site
Air Toxics Monitoring Network: Pilot sites and proposed trend sites
Comments on Historical Routine Networks • Adequate ground level spatial coverage • Especially PM2.5 mass, ozone • But, • Aerosols (mass and species) • too much reliance on integrated techniques providing no diurnal characterization • Criteria gases • Except for ozone and NO, many meaningless measurements • Trace levels, source oriented/microscale siting (CO, SO2)
Comments on Historical Routine Networks, cont. • But, • Other gases • NOy….very limited • True NO2..? • VOCs…mostly ozone season through PAMS • Other precursors and indicators • Nitric acid and ammonia….episodic/intensive programs only • Peroxides, hydroxyl radical….intensive programs only • Artifacts/problems….later • Very limited multiple pollutant sites • Act of convenience rather than design
Changes expected from Implementing National Monitoring Strategy
National Core Network: NCORE PM O3 • Goal: Move from loosely tied single-pollutant networks to coordinated, highly leveraged multi-pollutant networks with real time reporting capability NADP PAMS PM CO PM IMPROVE CASTNET PM O3 SO2 Toxics Instill order and communication
Principal Data Objectives of NCore I’d like to say………… “Characterize air quality as efficiently as possible in time, space and composition (physical and chemical properties)” Since any data use or objective relies on a fundamental characterization and benefits by enhancement….
Principal Data Objectives of NCore • Public Information • Real-time Input of Data From Across the Country Using Continuous Technologies • Spatial Mapping (E.G., AIRNOW), Health Advisories • Health/Exposure Assessment Support • Input for Periodic NAAQS Reviews • Emissions Strategy Planning (Emphasis on Initial Timeframe) • What are the best emission reduction approaches? • Provide DATA for Routine Model Evaluation and Source Attribution • Air Quality Trends and Program Accountability • Do measured data confirm strategies are working? • Major National Initiatives (Acid Rain, Clear Skies, NOx SIPS, FMVCP) • Including HAPS (National) and Visibility Assessments • Science Support • Backbone for More Diagnostic Level Work (Same for Local Sips), Health Studies • NAAQS Determinations and Related Regulatory Rqmts. • Emphasis on More Pervasive Ozone and PM2.5
NCore Measurements L2 Level 3 Level 1. 3-10 Master Sites Comprehensive Measurements, Advance Methods Serving Science and Technology Transfer Needs Level 2: ~ 75Multi-pollutant (MP) Sites,“Core Species” Plus Leveraging From PAMS, Speciation Program, Air Toxics L1 Level 3: Minimum Single Pollutant Sites (e.g.> 500 sites each for O3 and PM2.5 and related spatial Mapping Support Minimum “Core” Level 2 Measurements Continuous NO,NOy,SO2,CO, PM2.5, PM10/PMc,O3,Meteorology (T,RH,WS,WD); Integrated PM2.5 FRM, HNO3, NH3,
Siting Approach – Level 2 • Balance between functional design (best locations) and logistical concerns (national equity, capable agencies) • Step 1….Assume ~ 50 major U.S. cities provide variety for health scientists….long term epidemiological studies • Step 2….Identify important rural/regional gaps for model evaluation • Step 3….Leverage existing infrastructure (Speciation/IMPROVE and CASTNET networks; PAMS, air toxics NATTS) • Step 4…provide siting and implementation oversight • ???
23 21 18 14 15 3 1 2 7 6 16 4 19 17 8 13 5 10 9 12 11 20 24 Proposed Siting Approach – Level 2… Health meets atmospheric sciences Suggested Rural Locations for Level 2 Sites Transport, Corridor, Background and Inflow Locations
Urban & Rural PM2.5 Speciation Networks Current/Planned Supplemental Information
Today Core Spec PAMS Toxics Core PM Spec PAMS Core Spec Toxics Core + PM spec Core Future Directions Air Toxic Monitoring Visibility – IMPROVE & Regional Haze Ozone – PAMS Fine Particles – PM2.5 Chemical Speciation Inhalable Particles – PM10 Acid Deposition– CASTNet NADP
NCore: Further Integration & Optimization • NOAA/NASA Satellite Data • Global/Continental transport • Other Networks: Deposition, Ecosystems • Intensive/diagnostic Field Programs Longer Term Goal: • Integrated Observation-modeling Complex • Similar to Meteorological Models (FDDA) • Model Adjustments Through Obs. • All in Near Real Time • Full Delivery of Model Dimensions • (Space, Time, Chemistry, Physical Properties)
Recent efforts fostering NCORE implementation • Air toxics NATTS (trend sites) at PM2.5 speciation locations • Addition of aethalometers to NATTS • Joint OAQPS-OAP (within OAR) test program at CASTNET site(s) • Additional flexibility in use of STAG (e.g., PM2.5) funds to support more precursor and indicator measurements • RPO initiatives….
Issue • ? Funding for Level 1 sites
Introduction to measurement…Modeling ……………..incommensurabilities and other issues • Spatial representation • Volumetric (model) versus point representation (measurement) • Breathing level measurements….most of mass often elevated • Measurement Artifacts • Model attempts to characterize reality relative to true ambient properties, and natural removal processes (e.g., deposition to land/water/foliage) • Measurements techniques alter ambient properties (heating, dehumidification), and removal processes (changing concentration gradients) within sampler universe