Download
1 / 31
310 likes | 444 Views
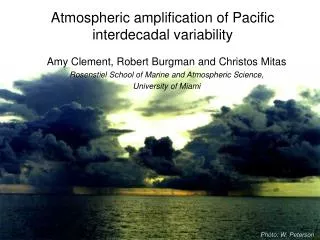
Atmospheric amplification of Pacific interdecadal variability. Amy Clement, Robert Burgman and Christos Mitas Rosenstiel School of Marine and Atmospheric Science, University of Miami. Photo: W. Peterson. What is the origin of the subtropical SST signal?.

E N D
Atmospheric amplification of Pacific interdecadal variability Amy Clement, Robert Burgman and Christos Mitas Rosenstiel School of Marine and Atmospheric Science, University of Miami Photo: W. Peterson
What is the origin of the subtropical SST signal? Hypothesis: Subtropical signal arises from atmospheric radiative feedbacks Deser epochs 1925 1945 1976
Precipitation Cloudiness COLD – WARM EPOCHS Other surface based observations (Deser et al. 2004) Increased cloud cover coincides with colder subtropical SST
Deser et al. (2004) Multivariate EOF analysis (Chen Poster Next Door) Passive Microwave Era
SST linear trend 1987- 2004 (degrees/decade) SLP linear trend 1987- 2004 (mb/decade) SST linear trend 1987- 2004 GLOBAL MEAN REMOVED
Datasets • High Resolution Infrared Sounder (HIRS) OLR (Jan 1979 – Dec 2003)- Retrievals from TIROS-N series operational polar orbiting environmental satellites (Ha-Tien Lee) • SSMI water vapor and surface wind speed (Sep 1987 – present)
SST trend (degrees/ decade) HIRS OLR (Wm-2/ decade)
SST trend (degrees/ decade) Water vapor (mm/decade)
SST trend (degrees/ decade) Surface wind speed (ms-1/ decade)
Precipitation Cloudiness COLD – WARM EPOCHS Other surface based observations (Deser et al. 2004) Increased cloud cover coincides with colder subtropical SST
Remotely forced boundary layer feedback? Results from Deser et al. (2006)
Implications for regional climate COLD – WARM EPOCHS Strong eastern subtropical SLP signal strong precip signal over southwestern US Cold SST, High SLP, Dry SW US
Implications for global climate SST Linear trend 1900-2004 (degrees per century)
Implications for global climate (1) Zhang and Walker 2006 Weaker tropical circulation [ (1) Zhang and Walker 2006; (2) Vecchi et al. 2006 ] consistent with warming subtropics (2) Vecchi et al. (2006)
Conclusions • While previous climate transitions have been shown in surface observations, satellite obs can now reveal possible mechanisms giving rise to regional SST anomalies. • SLP, OLR and water vapor indicate some atmospheric feedback (water vapor/ boundary layer clouds) contributing to the subtropical SST signal. Surface based observations of previous transitions appear to indicate a low cloud signal. • Cloud, water vapor, radiative fluxes are needed to quantify this • SLP signal appears to be remotely forced from the tropics, but better simulated (in SLP) with high resolution model • Understanding these subtropical processes may have implications for both regional and global climate.
Show windestress pattern to show that the signal is not from turbulent heat fluxes Force atmosphere model with this SST pattern in and mixed-layer outside
Enso regression pattern (to compare amplitude of off equatorial thing) • Slp regression on pc1
Local feedbacks that can amplify surface warming • Low clouds via lower tropospheric stability • Local greenhouse effect via boundary layer deepening (betts ridgway curve)
hypothesis • Atmosphere amplifies decadal SST pattern: Warming in central pacific (El Nino) causes reduced subsidence in the eastern subtropics, weaker subtropical high, increased water vapor (deeper boundary layer) and warmer SST; and a feedback between these that amplifies warming • Does the off-equatorial response influence the initial cause? i.e. Warmer off equatorial SST drives westerly wind anomaly which causes the central Pacific warming to persist (via downwelling) positive feedback • Consequences: • Coupled models- if the subtropical feedback is not active (i.e. if there is no column integrated water/olr/sst response) then there will not be a reddening • Global warming trend? Feedbacks in the subtropics matter for climate sensitivity • Amip models don’t get the feedback right because the signal is coming from the atm & coupling with SST which is not active in fixed sst (you could compare cam amip results with toga runs) • Issues • Enso state varies even within a warm/cold decade- so how does the feedback persist? • Threshold? i.e. it takes a really large event to kick off the feedback • What causes the change of sign? Timescale? • What about soden work (would get drying in subtropics in response to enso)
Zhang and mcphaden/lohmann and latif • Spiciness? • Manabe and stouffer paper • Read non-linear amplification paper • Do coupled gcms get the off-equatorial part? • Has anyone explained that yet? • CAM experiments: • compare the slp, wind speed, water vapor, cloud cover, olr in TOGA runs (eventually compare with GOGA to see what local sst is doing (?)) • Joel N papers • Sst indices- is decadal signal larger? • SLP indices show that the Deser epoch appear in SLP gradient between subtropics and equator such that warm periods have weaker trade winds and cold periods have stronger trades • Use had slp data • Plot SLP index (N&S) together with the zonal index or CTI- is there a feedback? • Barnett& pierce 1999, 2000