Download
1 / 20
200 likes | 349 Views
Modelling of Mountain Precipitation. Andreas F. Prein Wegener Center for Climate and Global Change (WEGC) and Institute for Geophysics, Astrophysics, and Meteorology (IGAM), Institute of Physics, University of Graz, Graz, Austria Workshop on Statistical Applications to Climate Extremes

E N D
Modelling of Mountain Precipitation Andreas F. Prein Wegener Center for Climate and Global Change (WEGC) and Institute for Geophysics, Astrophysics, and Meteorology (IGAM), Institute of Physics, University of Graz, Graz, Austria Workshop on Statistical Applications to Climate Extremes 30 October, 2012, Zurich, Switzerland
Overview • Introduction • Orographic Precipitation & Extremes • A Simple Concept of Heavy Precipitation • Modelling of Orographic Precipitation • A Scale Problem • Model Performance • Higher Resolution Higher Quality? • Model Projections of Future Climate • Summary and Outlook Prein, Workshop on Statistical Applications to Climate Extremes, 2012
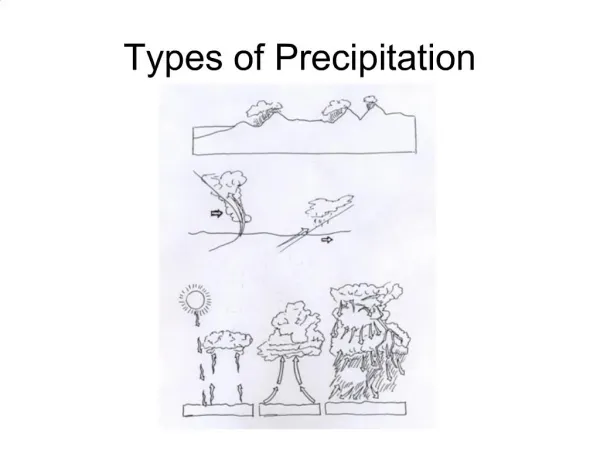
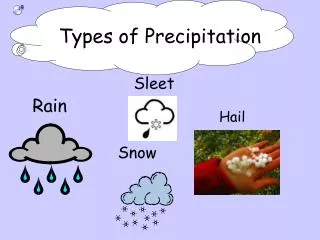
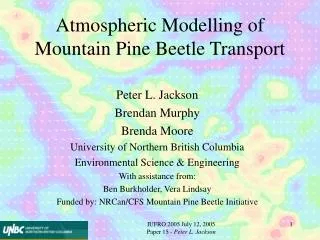
1. IntroductionOrographic Precipitation & Extremes Precipitation generated/enhanced by a forced upward movementof air due to orography NOAA PRISM Group, Oregon Stade University Prein, Workshop on Statistical Applications to Climate Extremes, 2012
1. IntroductionASimpleConcept of Heavy Precipitation C. F. Chappell “the heaviest precipitation occurs where the rainfall rate is highest for the longest time” Floods: associated with slow-moving precipitation systems extreme precipitation events: related to deep convection ! Relationship Precip.total and other factors is multiplicative nonlinear Prein, Workshop on Statistical Applications to Climate Extremes, 2012
Overview • Introduction • Orographic Precipitation & Extremes • A Simple Concept of Heavy Precipitation • Modelling of Orographic Precipitation • A Scale Problem • Model Performance • Higher Resolution Higher Quality? • Model Projections of Future Climate • Summary and Outlook Prein, Workshop on Statistical Applications to Climate Extremes, 2012
2. Modelling of Orographic Precip.A Scale Problem • Downscaling Methods • Dynamical Downscaling: Regional Climate Models (RCMs) [Giorgi and Mearns 1991] • Statistical Downscaling [Wilby and Wigley 1997] • Stretched Grid Models [Staniforth and Mitchell 1978] Time and Space Scale of Atmospheric Motion Scale Global Climate Models (GCMs) Global Scale 5000 km Regional Climate Models (RCMs) Synoptic Scale 200 km Convection Permitting Modells (CPMs) Mesoscale 20 km Microscale 2 m Convection Permitting Scale ~<4 km grid spacing Seconds to minutes Minutes to hours Hours to days Days to a week or more Time Extreme precipitation Processes on all scales Prein, Workshop on Statistical Applications to Climate Extremes, 2012
2. Modelling of Orographic Precip.Model Performance Moisture Supply • GCMs • underestimate intensityof extreme precip. in mountain regions • Deficits in simulating quasi-stationary circulation patterns • RCMs • improve representation of hydrological cycle in mountainous regions[e.g., Jones et al. 1995, Giorgi et al. 2001] but can only partly correct systematic errors in large-scale forcing • Convection Permitting Simulations major improvements on mesoscale: • Location and Intensity of extreme precipitation [Hohenegger et al. 2009, Prein et al. 2012] • Timing of the summertime precipitation diurnal cycle [Hohenegger et al. 2008, Prein et al. 2012] • Orographic precipitation patterns[ Rassmussen et al. 2011, Prein et al. 2012] Prein, Workshop on Statistical Applications to Climate Extremes, 2012
2. Modelling of Orographic Precip.Higher Resolution Higher Quality? Summertime Average Extreme WRF 4 km WRF 12 km WRF 36 km Prein et al. 2012 Prein, Workshop on Statistical Applications to Climate Extremes, 2012
2. Modelling of Orographic Precip.Higher Resolution Higher Quality? Winter Average Extreme WRF 4 km WRF 12 km WRF 36 km Spatial Correlation Coefficients: 0.80 0.78 0.65 Prein et al. 2012 Prein, Workshop on Statistical Applications to Climate Extremes, 2012
2. Modelling of Orographic Precip.Higher Resolution Higher Quality? -61 % September 19th-21st 1999 event using the COSMO-CLM Model -11 % 0 % Observation [2 km] • Finer grids more precipitation (frontal systems) • 12 km necessary to get location of maxima • Finer grids more spatial variability -9.9 mm/d -2.9 mm/d +3.3 mm/d STDDEV: +5 % Difference: +3.7 mm/d 50 km Model 12 km Model 3 km Model 1 km Model Prein, Workshop on Statistical Applications to Climate Extremes, 2012
2. Modelling of Orographic Precip.Model Projections of Future Climate Maximum grid point event-total precipitation [mm/d] versus elevation Max hail/graupel by elevation [mm] • Models underestimate the observed increase in heavy precipitation with warming [Allan and Soden 2008]. • Most GCMs/RCMs show increase in frequency and intensity of heavy precipitation events [e.g., Kharin and Zwiers 2000, Hennessy et al. 1997, Giorgi et al. 2011]. • Changes in the Physics of Extreme Events[e.g. Mahoney et al. 2012] • More Intense storms in Colorado Front Range and Rocky Mountain regions • Less hail reaching the surface Prein, Workshop on Statistical Applications to Climate Extremes, 2012
2. Modelling of Orographic Precip.Model Projections of Future Climate • Clausius-Clapeyron (CC)-Scaling • In a warmer climate moisture content increase by ~7 %/K [e.g., Emori & Brown 2005; Held & Soden 2006; Allan & Soden 2008; Prein at al. 2011] • Global Precipitation and Evaporation increase with ~1-3%/K [IPCC 2001, Allen & Ingram 2002; O’Gorman et al 2011] due to energy budget of free atmosphere • Orographic Precipitation likely increase with ~7%/K [Schmidli et al. 2002; Schär & Frei 2005; Shi and Durran 2012] Current: Future: up to 99 % condensation Up to 99 % condensation Precipitable Water [70 mm] Precipitable Water [50 mm] [10 mm] [13 mm] 40 mm 57 mm Prein, Workshop on Statistical Applications to Climate Extremes, 2012
Overview • Introduction • Orographic Precipitation & Extremes • A Simple Concept of Heavy Precipitation • Modelling of Orographic Precipitation • A Scale Problem • Model Performance • Higher Resolution Higher Quality? • Model Projections of Future Climate • Summary and Outlook Prein, Workshop on Statistical Applications to Climate Extremes, 2012
3. Summary and Outlook Major Challenges Possible Solutions • Trends in Extremes are hard to detect • Detection probability of events decreases with increasing rareness[Frei and Schär 2001] • Can we trust our models? • How large are the model errors and how can we reduce them?(Problems: observations, resolved scales, physical understanding, uncertainties,…) • How will the processes change? • Climate moistening, microphysics (hail, snow), soil-moisture-atmosphere, runoff… • Are changes dependent on region, season… • How will the ingredients change? • Changes in global circulation • Will ingredients for extreme events occur more frequently? • Will a different set of ingredients lead to extremes? • Focus on more frequent moderate intensity • Usage of extreme value statistic • Evaluation of models with observations • Model intercomparison studies (ensembles) • Model development • Finer grid spacings • Pseudo climate warming simulations • Toy models, Idealized simulations • Coupling of RCMs with regional ocean models, runoff models… • High resolution global simulations • Stretched grid models • Regionalization of GCM projections Prein, Workshop on Statistical Applications to Climate Extremes, 2012
Thank you for your attention Prein, Workshop on Statistical Applications to Climate Extremes, 2012
Prein, Workshop on Statistical Applications to Climate Extremes, 2012
Problems with Orographic Precipitation Spatial Variability – Station Density; Radar Shadows Processes on different scales (synoptic – micro scale) Measurement Errors (especially in DJF) Prein, Workshop on Statistical Applications to Climate Extremes, 2012
Spatial Field of Extreme Precipitation Precipitation over the Alps feeds four major European rivers and plays a crucial role in supplying water to the continent, in shaping Alpine ecosystems and in providing hydropower for civilization. Heavy precipitation can also cause flash floods, land slides and avalanches. This map shows observed precipitation in August 2005, when more than 150 mm of rain fell within 3 days over Austria, Germany and Switzerland. Six casualties and more than 2 billion Euros in damage occurred within Switzerland alone. (Source: MeteoSwiss) http://www.euro4m.eu/High_resolution_precipitation_data.html Prein, Workshop on Statistical Applications to Climate Extremes, 2012
Ingreediance of Extreme Precip Summertime Thunderstorms An example: The Big Thompson River flood (Colorado 1976) An conditionally or potentially unstable airmass Weak environmental shear Humid environment – weak outflow Thermal induced upslope winds East West Moisture Supply GREAT PLAINS FRONT RANGE Prein, Workshop on Statistical Applications to Climate Extremes, 2012
2. Modelling of Orographic Precip.Higher Resolution Higher Quality? Winter precipitation [mm/d] 45km-CRCM T32-CGCM Obs. (Willmott and Matsuura) [Laprise 2010] Improvement in the intensity and location Shadow effect downstream of the Rocky Mountains Prein, Workshop on Statistical Applications to Climate Extremes, 2012