Download
1 / 17
170 likes | 331 Views
Atmospheric Modelling of Mountain Pine Beetle Transport. Peter L. Jackson Brendan Murphy Brenda Moore University of Northern British Columbia Environmental Science & Engineering With assistance from: Ben Burkholder, Vera Lindsay Funded by: NRCan/CFS Mountain Pine Beetle Initiative.

E N D
Atmospheric Modelling of Mountain Pine Beetle Transport Peter L. Jackson Brendan Murphy Brenda Moore University of Northern British Columbia Environmental Science & Engineering With assistance from: Ben Burkholder, Vera Lindsay Funded by: NRCan/CFS Mountain Pine Beetle Initiative IUFRO 2005 July 12, 2005 Paper 15 - Peter L. Jackson
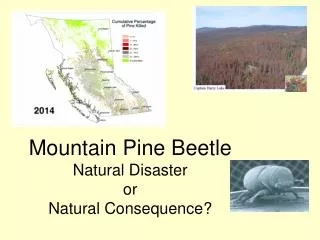
Mountain Pine Beetle (MPB) infestation • has reached epidemic proportions in central BC affecting more than 7 million ha and 280 million m3 of timber (2004 red attack) a) d) • successful reproduction requires • mass attack to overwhelm tree b) c) Photo credits (clockwise from top): a) http://www.ecoforestry.ca/jrnl_artilces/images/17-1-Partridge-Reuters.jpg b&c) http://www.sparwood.bc.ca/forest/untreated.htm d) http://www.pfc.forestry.ca/entomology/mpb/management/ silviculture/images/valley_lrg.jpg IUFRO 2005 July 12, 2005 Paper 15 - Peter L. Jackson
MPB Behaviour • behaviour to a large extent is meteorologically controlled • Emergence and flight in summer after 3 days of Tmax > 18 ºC but < 30°C • Peak emergence for successful mass-attack occurs when Tmax > 25 ºC IUFRO 2005 July 12, 2005 Paper 15 - Peter L. Jackson
Dispersion is • active by flight over short distances / light wind (local scale: within stand over a few km) • passive advection due to winds and turbulence above and within canopy (landscape scale: between stands perhaps 10-100 km) • Passive transport allows epidemic to spread rapidly over great distances little is known about passive transport and this is the focus of our work IUFRO 2005 July 12, 2005 Paper 15 - Peter L. Jackson
MPB Spread in BC 1959-2002 • animation based on annual aerial survey of MPB “reds” (last year’s attack) IUFRO 2005 July 12, 2005 Paper 15 - Peter L. Jackson
MPB Infestation 2005 • eastward movement of the “front” • spread of MPB limited by the -40 ºC annual minimum isotherm • climate change moves -40 ºC northeastward • concern over MPB crossing the Rocky Mountains and affecting the Jack Pine stands of Northern Canada IUFRO 2005 July 12, 2005 Paper 15 - Peter L. Jackson
Methods • Passive transport of MPB is similar to transport and dispersion of air pollutants • CSU Regional Atmospheric Modeling System (RAMS) to simulate the atmosphere (wind, temperature, humidity, pressure, etc. on a nested 3D grid) for both realistic and idealized simulations • The meteorological fields from RAMS are used to calculate trajectories IUFRO 2005 July 12, 2005 Paper 15 - Peter L. Jackson
The Synoptic weather pattern determines the atmospheric background conditions in which MPB emerge and move. • Average weather pattern(s) associated with MPB flight are found using compositing • This leads to an understanding of regional wind patterns during flight IUFRO 2005 July 12, 2005 Paper 15 - Peter L. Jackson
Synoptic Climatology • It is likely that passive transport will be most important when peak emergence is occurring • Peak emergence is associated with higher temperatures • Define HC2 as days with Tmax > 25 C, but < 30 C IUFRO 2005 July 12, 2005 Paper 15 - Peter L. Jackson
composite 2002 • Evolution of HC2 composite 500 hPa and Lifted Index (shaded) based on NCEP Reanalysis data • as upper ridge passes atmosphere becomes moderately unstable (Lifted index negative) resulting in “thermals” (see poster) IUFRO 2005 July 12, 2005 Paper 15 - Peter L. Jackson
Idealized Simulations • goal is to understand how atmospheric flows in complex terrain might affect MPB transport • Idealized (sinusoidal) terrain inserted into RAMS • Under light synoptic conditions generate anabatic (upslope) flows by day • Intent is to insert “particles” into the flow field and see how they are dispersed • N-S vertical cross section with ridges running W-E in afternoon • Contours = Temperature IUFRO 2005 July 12, 2005 Paper 15 - Peter L. Jackson
Realistic Simulation Prince George Infestation East of Rockies – initiated in 2002: Hourly output from RAMS simulation at model level 2 (~40 m AGL), from grid 4 at 3 km horizontal resolution (only every 2nd wind vector shown) IUFRO 2005 July 12, 2005 Paper 15 - Peter L. Jackson
Back Trajectories ending at 00Z 24 July 2002 (17:00 PDT) • issue is: how high do they fly? • entomologists don’t know • weather radar offers promise… 105m 1100m IUFRO 2005 July 12, 2005 Paper 15 - Peter L. Jackson
July 14-15, 2004 Peak emergence event IUFRO 2005 July 12, 2005 Paper 15 - Peter L. Jackson
0.5 degree PPI radar scan from 00Z 15 July 2004 (1700 PDT 14 July 2004) Reflectivity < 0 DBZ Echo tops 800 – 1500 m AGL Doppler radar image “clear air” returns are some type of insect timing of appearance is consistent with peak emergence of MPB – click here for animation IUFRO 2005 July 12, 2005 Paper 15 - Peter L. Jackson
The End IUFRO 2005 July 12, 2005 Paper 15 - Peter L. Jackson
Conclusions & Future Work • RAMS seems capable of representing the conditions during MPB emergence and flight • Approaches to future atmospheric modelling: • Continue idealized simulations in relation to terrain • “rules of thumb” for beetle spread on the landscape • Continue simulation / validation of case studies to predict where beetles go from one year to the next. • used in real time for planning beetle control strategies • Ensemble trajectories created for each grid point in the landscape, based on a runs of a large number of past peak emergence heating cycle events. • used as input to beetle spread scenarios models for forest managers to assess the impact of silvicultural and management practices IUFRO 2005 July 12, 2005 Paper 15 - Peter L. Jackson