GDP per Capita: Highest
320 likes | 801 Views
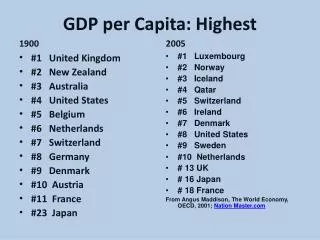
GDP per Capita: Highest. 1900. 2005. #1 Luxembourg #2 Norway #3 Iceland #4 Qatar #5 Switzerland #6 Ireland #7 Denmark #8 United States #9 Sweden #10 Netherlands # 13 UK # 16 Japan # 18 France

GDP per Capita: Highest
E N D
Presentation Transcript
GDP per Capita: Highest 1900 2005 #1 Luxembourg #2 Norway #3 Iceland #4 Qatar #5 Switzerland #6 Ireland #7 Denmark #8 United States #9 Sweden #10 Netherlands # 13 UK # 16 Japan # 18 France From Angus Maddison, The World Economy, OECD, 2001; Nation Master.com • #1 United Kingdom • #2 New Zealand • #3 Australia • #4 United States • #5 Belgium • #6 Netherlands • #7 Switzerland • #8 Germany • #9 Denmark • #10 Austria • #11 France • #23 Japan
GDP per Capita: Lowest (2005) • Burundi • Ethiopia • Congo • Liberia • Malawi • Guinea-Bissau • Sierra Leone • Eritrea • Rwanda • Afghanistan Source: The Economist, Pocket World in Figures, 2006, p. 28.
Developing World • South • LDCs • Third World • Latin America • Asia • Africa
Middle East Colonized (roughly WWI)http://www.npr.org/news/specials/mideast/the_west/colonies_map.html
Independence • Latin America (by 1823) • Middle East (after WW I) • Africa and Asia (post-WW II)
Strategies for Development • Modernization: Be like the west • Nationalization: Seize assets of wealthy nations in a developing nation (related to Dependency) • Marxism: Use Soviet Union as a model • Group Efforts • East Asian Strategy
1. Modernization : Basic Dilemma EDCs LDCs North America Western Europe Japan Large middle class High Tech Industrial products High skills High wages Cars, chemicals, aerospace, telecomm, electronics, software Africa, Asia, Middle east, Latin America Primary products Commodities Elites -- impoverished Low skills Low wages Bananas, coffee, minerals, rubber, timber
The Flow of Money $$$$$$: cars, computers, manufactured goods $$: bananas, coffee, timber, minerals EDCs LDCs
2. Nationalization Dilemma Global Wealth ranking by GDP per capita (for nations following Nationalization strategies after WW II) 1900 1950 2005 • Argentina 12 12 31 • Chile 16 16 53 • Mexico 22 27 57 • Colombia 25 26 76 • Venezuela 27 4 84 (data from: Nation Master.Com: http://www.nationmaster.com/index.php)
3. Marxism Clockwise from the top: Statue of Kim Il-sung, North Korean leader from 1948-1994; skulls left by the Khmer Rouge, in power in Cambodia from 1975-1978; Fidel Castro, dictator of Cuba 1959-?
4. Group Efforts • NIEO • UNCTAD • Group of 77 • OPEC
5. East Asian Strategy • Japan as the Model • Business-Government Partnership • Open up the Economy to Foreign Investment • Exports! • Export Processing Zones • Building Home Companies
Four Tigers • Hong Kong Singapore • South Korea Taiwan
Integrating into the World Economy Parts Unfinished imports exports products Finished Components products Export Processing Zone
The Biggest of the Big Emerging Markets • China 1978 • Deng Xiaoping
Indian Reform 1991 P. V. N. Rao Manmohan Singh PM 1991-1996 Min of Finance 91-96 PM 2004-present
China and India and Asian Growth • China 1.3 billion • India 1.0 billion • 2.6 billion of 7 billion humans; statistically the largest economic reform program in world history • Add Southeast Asia: • 3.5 billion entering the modern world economy • Tallest Buildings in the world today • The Future
Fastest Growing Economies 1983-1993 1997-2007 Equatorial Guinea Turkmenistan Azerbaijan Myanmar Armenia Qatar China Angola Cambodia Bhutan • China • Thailand • Botswana • Taiwan • South Korea • Macau • Chile • Singapore • Indonesia • Malaysia Source: The Economist, Pocket World in Figures, 2006 and 2010, p. 32-33.


![[pe r vert] Inc.](https://cdn1.slideserve.com/3053078/pe-r-vert-inc-dt.jpg)


![[pe r vert] Inc.](https://cdn3.slideserve.com/6580533/pe-r-vert-inc-dt.jpg)