Download

1 / 40
400 likes | 625 Views
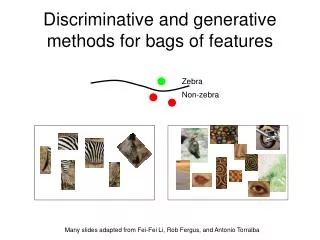
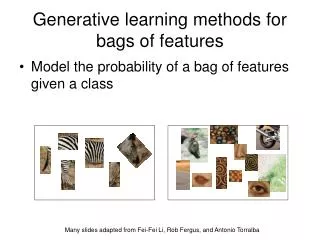
Discriminative and generative methods for bags of features. Zebra. Non-zebra. Many slides adapted from Fei-Fei Li, Rob Fergus, and Antonio Torralba. Image classification.

E N D
Discriminative and generative methods for bags of features Zebra Non-zebra Many slides adapted from Fei-Fei Li, Rob Fergus, and Antonio Torralba
Image classification • Given the bag-of-features representations of images from different classes, how do we learn a model for distinguishing them?
Discriminative methods • Learn a decision rule (classifier) assigning bag-of-features representations of images to different classes Decisionboundary Zebra Non-zebra
Generative methods • Model the probability of a bag of features given a class
Classification • Assign input vector to one of two or more classes • Any decision rule divides input space into decision regions separated by decision boundaries
Nearest Neighbor Classifier • Assign label of nearest training data point to each test data point from Duda et al. Voronoi partitioning of feature space for 2-category 2-D and 3-D data Source: D. Lowe
K-Nearest Neighbors • For a new point, find the k closest points from training data • Labels of the k points “vote” to classify • Works well provided there is lots of data and the distance function is good k = 5 Source: D. Lowe
Functions for comparing histograms • L1 distance • χ2 distance • Quadratic distance (cross-bin) Jan Puzicha, Yossi Rubner, Carlo Tomasi, Joachim M. Buhmann: Empirical Evaluation of Dissimilarity Measures for Color and Texture. ICCV 1999
Earth Mover’s Distance • Each image is represented by a signatureS consisting of a set of centers {mi } and weights {wi } • Centers can be codewords from universal vocabulary, clusters of features in the image, or individual features (in which case quantization is not required) • Earth Mover’s Distance has the formwhere the flowsfij are given by the solution of a transportation problem Y. Rubner, C. Tomasi, and L. Guibas: A Metric for Distributions with Applications to Image Databases. ICCV 1998
Linear classifiers • Find linear function (hyperplane) to separate positive and negative examples Which hyperplaneis best?
Support vector machines • Find hyperplane that maximizes the margin between the positive and negative examples C. Burges, A Tutorial on Support Vector Machines for Pattern Recognition, Data Mining and Knowledge Discovery, 1998
Support vector machines • Find hyperplane that maximizes the margin between the positive and negative examples For support, vectors, Distance between point and hyperplane: Therefore, the margin is 2 / ||w|| Support vectors Margin C. Burges, A Tutorial on Support Vector Machines for Pattern Recognition, Data Mining and Knowledge Discovery, 1998
Finding the maximum margin hyperplane • Maximize margin 2/||w|| • Correctly classify all training data: • Quadratic optimization problem: • Minimize Subject to yi(w·xi+b) ≥ 1 C. Burges, A Tutorial on Support Vector Machines for Pattern Recognition, Data Mining and Knowledge Discovery, 1998
Finding the maximum margin hyperplane • Solution: learnedweight Support vector C. Burges, A Tutorial on Support Vector Machines for Pattern Recognition, Data Mining and Knowledge Discovery, 1998
Finding the maximum margin hyperplane • Solution:b = yi – w·xi for any support vector • Classification function (decision boundary): • Notice that it relies on an inner product between the testpoint xand the support vectors xi • Solving the optimization problem also involvescomputing the inner products xi· xjbetween all pairs oftraining points C. Burges, A Tutorial on Support Vector Machines for Pattern Recognition, Data Mining and Knowledge Discovery, 1998
x 0 x 0 x2 Nonlinear SVMs • Datasets that are linearly separable work out great: • But what if the dataset is just too hard? • We can map it to a higher-dimensional space: 0 x Slide credit: Andrew Moore
Nonlinear SVMs • General idea: the original input space can always be mapped to some higher-dimensional feature space where the training set is separable: Φ: x→φ(x) Slide credit: Andrew Moore
Nonlinear SVMs • The kernel trick: instead of explicitly computing the lifting transformation φ(x), define a kernel function K such thatK(xi,xjj) = φ(xi )· φ(xj) • (to be valid, the kernel function must satisfy Mercer’s condition) • This gives a nonlinear decision boundary in the original feature space: C. Burges, A Tutorial on Support Vector Machines for Pattern Recognition, Data Mining and Knowledge Discovery, 1998
Kernels for bags of features • Histogram intersection kernel: • Generalized Gaussian kernel: • D can be Euclidean distance, χ2distance,Earth Mover’s Distance, etc. J. Zhang, M. Marszalek, S. Lazebnik, and C. Schmid, Local Features and Kernels for Classifcation of Texture and Object Categories: A Comprehensive Study, IJCV 2007
Pyramid match kernel • Fast approximation of Earth Mover’s Distance • Weighted sum of histogram intersections at mutliple resolutions (linear in the number of features instead of cubic) optimal partial matching between sets of features K. Grauman and T. Darrell. The Pyramid Match Kernel: Discriminative Classification with Sets of Image Features, ICCV 2005.
Review: Discriminative methods • Nearest-neighbor and k-nearest-neighbor classifiers • L1 distance, χ2 distance, quadratic distance, Earth Mover’s Distance • Support vector machines • Linear classifiers • Margin maximization • The kernel trick • Kernel functions: histogram intersection, generalized Gaussian, pyramid match • Of course, there are many other classifiers out there • Neural networks, boosting, decision trees, …
Summary: SVMs for image classification • Pick an image representation (in our case, bag of features) • Pick a kernel function for that representation • Compute the matrix of kernel values between every pair of training examples • Feed the kernel matrix into your favorite SVM solver to obtain support vectors and weights • At test time: compute kernel values for your test example and each support vector, and combine them with the learned weights to get the value of the decision function
What about multi-class SVMs? • Unfortunately, there is no “definitive” multi-class SVM formulation • In practice, we have to obtain a multi-class SVM by combining multiple two-class SVMs • One vs. others • Traning: learn an SVM for each class vs. the others • Testing: apply each SVM to test example and assign to it the class of the SVM that returns the highest decision value • One vs. one • Training: learn an SVM for each pair of classes • Testing: each learned SVM “votes” for a class to assign to the test example
SVMs: Pros and cons • Pros • Many publicly available SVM packages:http://www.kernel-machines.org/software • Kernel-based framework is very powerful, flexible • SVMs work very well in practice, even with very small training sample sizes • Cons • No “direct” multi-class SVM, must combine two-class SVMs • Computation, memory • During training time, must compute matrix of kernel values for every pair of examples • Learning can take a very long time for large-scale problems
Generative methods • Model the probability distribution that produced a given bag of features • We will cover two models, both inspired by text document analysis: • Naïve Bayes • Probabilistic Latent Semantic Analysis
The Naïve Bayes model • Assume that each feature is conditionally independent given the class Csurka et al. 2004
The Naïve Bayes model • Assume that each feature is conditionally independent given the class Likelihood of ith visual word given the class MAP decision Prior prob. of the object classes Estimated by empiricalfrequencies of visual wordsin images from a given class Csurka et al. 2004
The Naïve Bayes model • Assume that each feature is conditionally independent given the class • “Graphical model”: c w N Csurka et al. 2004
Probabilistic Latent Semantic Analysis zebra “visual topics” grass tree T. Hofmann, Probabilistic Latent Semantic Analysis, UAI 1999
Probabilistic Latent Semantic Analysis = α1 + α2 + α3 tree New image grass zebra T. Hofmann, Probabilistic Latent Semantic Analysis, UAI 1999
z d w Probabilistic Latent Semantic Analysis • Unsupervised technique • Two-level generative model: a document is a mixture of topics, and each topic has its own characteristic word distribution document topic word P(z|d) P(w|z) T. Hofmann, Probabilistic Latent Semantic Analysis, UAI 1999
z d w Probabilistic Latent Semantic Analysis • Unsupervised technique • Two-level generative model: a document is a mixture of topics, and each topic has its own characteristic word distribution T. Hofmann, Probabilistic Latent Semantic Analysis, UAI 1999
z d w “face” pLSA for images Document = image, topic = class, word = quantized feature J. Sivic, B. Russell, A. Efros, A. Zisserman, B. Freeman, Discovering Objects and their Location in Images, ICCV 2005
The pLSA model Probability of word i giventopic k (unknown) Probability of word i in document j(known) Probability oftopic k givendocument j(unknown)
The pLSA model documents topics documents p(wi|dj) p(wi|zk) p(zk|dj) words words topics = Class distributions per image (K×N) Observed codeword distributions (M×N) Codeword distributions per topic (class) (M×K)
Learning pLSA parameters Maximize likelihood of data using EM: Observed counts of word i in document j M … number of codewords N … number of images Slide credit: Josef Sivic
Recognition • Finding the most likely topic (class) for an image:
Recognition • Finding the most likely topic (class) for an image: • Finding the most likely topic (class) for a visual word in a given image:
Topic discovery in images J. Sivic, B. Russell, A. Efros, A. Zisserman, B. Freeman, Discovering Objects and their Location in Images, ICCV 2005
Summary: Generative models • Naïve Bayes • Unigram models in document analysis • Assumes conditional independence of words given class • Parameter estimation: frequency counting • Probabilistic Latent Semantic Analysis • Unsupervised technique • Each document is a mixture of topics (image is a mixture of classes) • Can be thought of as matrix decomposition • Parameter estimation: EM