Download
1 / 4
40 likes | 159 Views
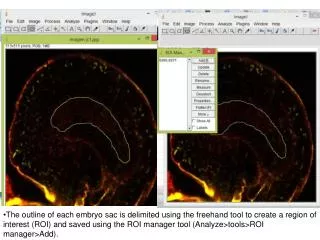
The outline of each embryo sac is delimited using the freehand tool to create a region of interest (ROI) and saved using the ROI manager tool (Analyze>tools>ROI manager>Add). In the “Analyze” menu, select “set measurements” and click on area and “mean gray value”.

E N D
The outline of each embryo sac is delimited using the freehand tool to create a region of interest (ROI) and saved using the ROI manager tool (Analyze>tools>ROI manager>Add).
In the “Analyze” menu, select “set measurements” and click on area and “mean gray value”. • Using the image Menu, select “color” and then “split channels”.
Close the image in the blue channel. On the green channel, go to the analyze>tools>ROI manager and select the ROI added before. The ROI will appear on the image. Still in the ROI manager go to more>multi Measure. The result will appear in a new window.