Assignment 2
Learn how to choose and use the right non-parametric test for nominal, ordinal, interval, and ratio data. Includes examples and interpretation.

Assignment 2
E N D
Presentation Transcript
Assignment 2 Slides by Mark Hancock
Non-Parametric Tests Slides by Mark Hancock
After the next section, you will be able to identify and apply the appropriate test to use for several types of data. Slides by Mark Hancock
Types of Data • Nominal • e.g., apples, oranges • Ordinal • e.g., low, medium, high • Interval • e.g., temperature in °C (+, -) • Ratio • e.g., temperature in Kelvin, time (×, ÷) Slides by Mark Hancock
Does it make sense to do a t-test/ANOVA on categorical data? Slides by Mark Hancock
Choice of Test Adapted from: Plonskey, 2001 Slides by Mark Hancock
Choice of Test Adapted from: Plonskey, 2001 Slides by Mark Hancock
Chi-Square (χ²) • Frequency data for each category • Compare observed frequency toexpected frequency (equal distribution) Slides by Mark Hancock
Null Hypothesis • The frequencies are equally distributed • What does high χ² mean? Slides by Mark Hancock
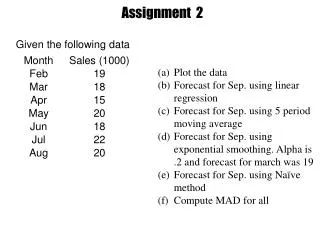
Example • 40 people were asked to state their favourite fruit. • 9 chose apples, 21 chose oranges, 4 chose peaches, and 6 chose another fruit Slides by Mark Hancock
Choice of Test Adapted from: Plonskey, 2001 Slides by Mark Hancock
Choice of Test Adapted from: Plonskey, 2001 Slides by Mark Hancock
Mann-Whitney U • Can compare factors with two levels only • Design is between-participants • Method: • assign each data point a rank (in the entire set) • TA = sum of ranks in group A • UA = (max possible TA) – (observed TA) • UA + UB = nAnB (use either) Slides by Mark Hancock
Null Hypothesis • Ranks in each group are on average the same • UA = UB = nAnB/2 • If n large enough (n > 5), can use z-test (a simpler t-test) on ranks Slides by Mark Hancock
Example • 15 Mac users and 15 Windows users were asked to rate the usability of their operating system on a scale of 1 (very unusable) to 9 (very usable) Slides by Mark Hancock
Choice of Test Adapted from: Plonskey, 2001 Slides by Mark Hancock
Choice of Test Adapted from: Plonskey, 2001 Slides by Mark Hancock
Wilcoxon Signed-Ranks • Can compare factors with two levels only • Design is within-participants • Method: • assign signed rank for each participant • each participant has value in each level (xi & yi) • obtain rank by ordering |xi – yi| and reapply sign • W = sum of signed ranks Slides by Mark Hancock
Null Hypothesis • Difference in ranks is on average zero • W = 0 • If n large enough (n > 9), use z-test, otherwise use table • Note n < 5 never significant at = .05 Slides by Mark Hancock
Example • 20 people were asked to rate the amount of fun they have playing both soccer and ultimate on a scale of 1 (worst. game. ever.) to 9 (best. game. ever.) Slides by Mark Hancock
Choice of Test Adapted from: Plonskey, 2001 Slides by Mark Hancock
Choice of Test Adapted from: Plonskey, 2001 Slides by Mark Hancock
Kruskal-Wallis H • Can compare factors with k > 2 levels • Design is between-participants • Method: • assign each data point a rank (in the entire set) • TA = sum of ranks in group A, μA = TA / nA • SSBG = sum (ni(μi – μall)²) • H = SSBG / ( n(n+1) / 12 ) Slides by Mark Hancock
Null Hypothesis • Mean ranks in each group are the same • H value equivalent to χ² • H is ratio of sum of ranks squared to expected rank Slides by Mark Hancock
Example • 10 Mac users, 10 Windows users, and 10 Linux users were each given 10 simple computer tasks to complete in 2 minutes or less (each). • The total number (out of 10) tasks that were successfully completed in the time given were tallied. Slides by Mark Hancock
Choice of Test Adapted from: Plonskey, 2001 Slides by Mark Hancock
Choice of Test Adapted from: Plonskey, 2001 Slides by Mark Hancock
Friedman’s ANOVA • Can compare factors with k > 2 levels • Design is within-participants • Method: • assign rank of 1 to k for each participant • SSBG = n·sum (μi – μall)² • χ² = SSBG / ( k(k+1) / 12 ) Slides by Mark Hancock
Null Hypothesis • Mean rank in each group is the same: • (k + 1)/2 • χ² is same as before • higher value lower p Slides by Mark Hancock
Example • 5 of my closest friends were asked how close they would be willing to stand next to me when I had (a) coded all day, (b) played squash for 1 hour, or (c) played ultimate for 6 hours. • Answers included: “an arm’s length”, “a 10 foot pole away”, “I’d be willing to hug you”, etc. Slides by Mark Hancock
Handy Chart Adapted from: Plonskey, 2001 Slides by Mark Hancock
Break: 15 Minutes Slides by Mark Hancock
Interpreting Analyses Slides by Mark Hancock
By the end of this lecture, you will be able to interpret and criticise the description of an experiment in a typical HCI paper. Slides by Mark Hancock
Parts of a Paper (APA) • Methods • Participants • Apparatus • Design • Procedure • Results • Discussion Slides by Mark Hancock
Method: Participants • Why is this section important? • Important Details: • age, sex (demographics) • how did you select them? • how did you compensate them for their time? • What biases might they bring to the study? • e.g., experience Slides by Mark Hancock
Example “12 volunteers (8 males and 4 females), aged between 23 and 38 participated in the experiment. 11 participants were right handed and controlled the pen with their right hand. All participants were frequent computer users and had experience with Windows. Eight participants had previously worked with digital tabletop systems. Eleven of them had already pen- and/or touch-based interface experience (e.g. Tablet PC).” Leithinger & Haller, Tabletop 2007 Slides by Mark Hancock
Common Mistakes • Too little detail • Too much detail (why might this be bad?) • Not enough participants • Participants don’t represent population • e.g., computer science students Slides by Mark Hancock
Method: Apparatus • Describes the environment used to test the participants • What criteria are necessary for a “good” Apparatus section? • possible to reproduce Slides by Mark Hancock
Example • “The display used for all four tasks was a 1024 × 768 pixels, 73.3 cm × 55.0 cm wall display. In all cases, the display space was a perspective grid representing five walls of a virtual room with lighting as an additional depth cue (see Figure 5). Participants were able to control a 3D cursor using a tracked light pen in the 73.3 cm × 55.0 cm × 55.0 cm volume directly in front of the display. Participants were given the option to sit, but all chose to stand throughout all trials. The pen was tracked using vision algorithms and input from two cameras mounted directly above the control space. Infrared filters were used to detect the near infrared lightfrom the pen light (non-LED).” • Keijser et al., 3DUI 2007 Slides by Mark Hancock
Common Mistakes • Not enough detail to reproduce • e.g., resolution without screen size • e.g., is person seated or standing • Apparatus/setup has inherent errors in measurement • e.g., device not sufficiently precise • e.g., unnecessary strain on participants Slides by Mark Hancock
Method: Design • Describes the way the experiment was controlled • Important details: • factors, dependent variables, constants • how did you assign participants to conditions? Slides by Mark Hancock
Example • “We used a 3x2x9 design with the following independent variables: display size (small, medium, large corresponding to within, equal to, and beyond visual acuity - data density was constant), visualization design (space-centric, attribute-centric), and task (3 detail, 4 overview, and 2 complex)… Display size was a between subjects variable while visualization and task were within subject variables. Task completion time, accuracy, subjective workload, and user preference were recorded.” • Yost et al., CHI 2007 Slides by Mark Hancock
Common Mistakes • Not enough detail • not reproducible Slides by Mark Hancock
Method: Procedure • What did each participant do? • Important details: • step-by-step description of task • what conditions must be met to end a trial? • practice • order of conditions, randomization, repetitions Slides by Mark Hancock
Example • “To begin a trial, participants pressed “enter”, and the word was presented. We wished to measure the time participants took to read the word before beginning to type. They were, instructed to press “enter” as soon as they recognised the word, which would then disappear, ensuring that they were no longer reading the text. A text box was then displayed, into which they would type the word and then press “enter” to finish the trial. If they typed an incorrect word, a tone would sound and the trial word would appear again, with the trial counted as an error. If, after beginning to enter their response, the participant wished to review the word, they could press “escape” to return to viewing the word – all such trials were also counted as errors. Lastly, if the participant failed to enter the correct word after 30 seconds, the trial would end and be counted as an error.” • Grossman et al., CHI 2007 Slides by Mark Hancock
Common Mistakes • Not enough detail • Confusing • reader can’t imagine what happened • Task doesn’t represent what you are trying to measure • e.g., measure strength of wrist by how far a person can throw a Frisbee Slides by Mark Hancock
Results (the fun begins…) • What do people need to know? • Important details: • what test you used • the important values for each test (e.g., F, df, etc.) • the means, SDs for (each) cell Slides by Mark Hancock
Example • “Total time on task and fixation measures were analyzed using2 (Task Type) x 6 (Target Position) repeated measures analysis of variance (ANOVA). The click accuracy was analyzed using a chi-square analysis.” • Guan & Cutrell, CHI 2007 Slides by Mark Hancock
Example • “We found a significant main effect of Target Position on the total time on task (F(5,85)=3.544, p=.006). This indicates that people spent significantly more time on a task when the target was displayed at a lower position. We also found a main effect for Task Type, F(1,17)=54.718, p<0.001… There was no significant interaction between Target Position and Task Type.” • “A chi-square analysis on the number of accurate clicks showed a significant effect for target position (χ²(5)=58.5, p<0.001). The click accuracy rate dropped from 84% (average of 78% and 89%) to about 11% when the target was displayed at position 8…” • Guan & Cutrell, CHI 2007 Slides by Mark Hancock