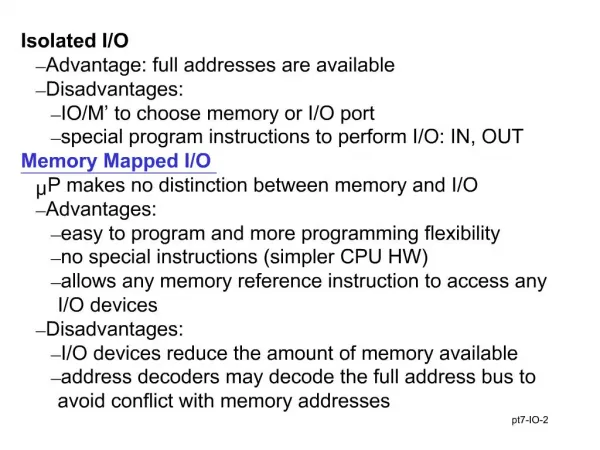
Input Modeling
Input Modeling. Modeling and Simulation CS 313. PURPOSE & OVERVIEW. Input models provide the driving force for a simulation model. The quality of the output is no better than the quality of input. In this chapter, we will discuss the 4 steps of input model development :

Input Modeling
E N D
Presentation Transcript
Input Modeling Modeling and Simulation CS 313
PURPOSE & OVERVIEW • Input models provide the driving force for a simulation model. • The quality of the output is no better than the quality of input. • In this chapter, we will discuss the 4 steps of input model development: • Collect data from the real system • Identify a probability distribution to represent the input process • Choose parameters for the distribution • Evaluate the chosen distribution and parameters for goodness of fit.
DATA COLLECTION • One of the biggest tasks in solving a real problem. GIGO –garbage-in-garbage-out • Suggestions that may enhance and facilitate data collection: • Plan ahead: begin by a practice or pre-observing session, watch for unusual circumstances • Analyze the data as it is being collected: check adequacy • Combine homogeneous data sets, e.g. successive time periods, during the same time period on successive days • Be aware of data censoring: the quantity is not observed in its entirety, danger of leaving out long process times • Check for relationship between variables, e.g. build scatter diagram • Check for autocorrelation • Collect input data, not performance data
IDENTIFYING THE DISTRIBUTION • Histograms • Selecting families of distribution • Parameter estimation • Goodness-of-fit tests • Fitting a non-stationary process
HISTOGRAMS [IDENTIFYING THE DISTRIBUTION] • A frequency distribution or histogram is useful in determining the shape of a distribution • The number of class intervals depends on: • The number of observations • The dispersion of the data • For continuous data: • Corresponds to the probability density function of a theoretical distribution • For discrete data: • Corresponds to the probability mass function • If few data points are available: combine adjacent cells to eliminate the ragged appearance of the histogram
HISTOGRAMS [IDENTIFYING THE DISTRIBUTION] • Vehicle Arrival Example: #of vehicles arriving at an intersection between 7 am and 7:05 am was monitored for 100 random workdays.
SELECTING THE FAMILY OF DISTRIBUTIONS[IDENTIFYING THE DISTRIBUTION] • A family of distributions is selected based on: • The context of the input variable: • Shape of the histogram • Frequently encountered distributions: • Easier to analyze: exponential, normal and Poisson • Harder to analyze: beta, gamma and Weibull
SELECTING THE FAMILY OF DISTRIBUTIONS[IDENTIFYING THE DISTRIBUTION] • Use the physical basis of the distribution as a guide, for example: • Binomial: # of successes in n trials • Poisson: # of independent events that occur in a fixed amount of time or space • Normal: dist’nof a process that is the sum of a number of component processes • Exponential: time between independent events, or a process time that is memory-less • Weibull: time to failure for components • Discrete or continuous uniform: models complete uncertainty • Triangular: a process for which only the minimum, most likely, and maximum values are known • Empirical: re-samples from the actual data collected
SELECTING THE FAMILY OF DISTRIBUTIONS[IDENTIFYING THE DISTRIBUTION] • Remember the physical characteristics of the process • Is the process naturally discrete or continuous valued? • Is it bounded? • No “true” distribution for any stochastic input process • Goal: obtain a good approximation
QUANTILE-QUANTILE PLOTS [IDENTIFYING THEDISTRIBUTION] • A Q-Q plot ("Q" stands for quantile) is a probability plot, which is a graphical method for comparing two probability distributions by plotting their quantiles against each other. • First, the set of intervals for the quantiles are chosen. • A point (x,y) on the plot corresponds to one of the quantiles of the second distribution (y-coordinate) plotted against the same quantile of the first distribution (x-coordinate). • Thus the line is a parametric curve with the parameter which is the (number of the) interval for the quantile.
QUANTILE-QUANTILE PLOTS [IDENTIFYING THEDISTRIBUTION] • Q-Q plots is to compare the distribution of a sample to a theoretical distribution, such as the standard normal distribution N(0,1), as in a normal probability plot. • As in the case when comparing two samples of data, one orders the data (formally, computes the order statistics), then plots them against certain quantilesof the theoretical distribution.
QUANTILE-QUANTILE PLOTS [IDENTIFYING THEDISTRIBUTION] • The plot of yj versus F-1( (j-0.5)/n)is approximately a straight line if F is a member of an appropriate family of distributions. • The line has slope 1if F is a member of an appropriate family of distributions with appropriate parameter values. • If the assumed distribution is inappropriate, the points will deviate from a straight line. • The decision about whether to reject some hypothesized model is subjective!!
QUANTILE-QUANTILE PLOTS [IDENTIFYING THEDISTRIBUTION] • Example: Check whether the door installation times follows a normal distribution. • The observations are now ordered from smallest to largest:
QUANTILE-QUANTILE PLOTS [IDENTIFYING THEDISTRIBUTION] • Consider the following while evaluating the linearity of a q-q plot: • The observed values never fall exactly on a straight line • The ordered values are ranked and hence not independent, unlikely for the points to be scattered about the line • Variance of the extremes is higher than the middle. Linearity of the points in the middle of the plot is more important. • Q-Q plot can also be used to check homogeneity • Check whether a single distribution can represent both sample sets • Plotting the order values of the two data samples against each other
PARAMETER ESTIMATION [IDENTIFYING THE DISTRIBUTION] • When raw data are unavailable (data are grouped into class intervals), the approximate sample mean and variance are: • A parameter is an unknown constant, but an estimator is a statistic.
PARAMETER ESTIMATION [IDENTIFYING THE DISTRIBUTION] • Vehicle Arrival Example (continued): table in the histogram example can be analyzed to obtain: