Download
1 / 13
130 likes | 236 Views
Explore results of NOAA project on understanding hypoxia in TX-LA shelf. Goals include creating a realistic model to assess environmental factors and strengthen predictive capabilities. Physical model uses ROMS v3.0 with detailed resolutions and inputs. Biological model focuses on nitrogen cycling and simplified sedimentary processes. Current limitations and data differences between years are noted. Summary discusses key features reproduced by the model and highlights the importance of including realistic sediment processes next.

E N D
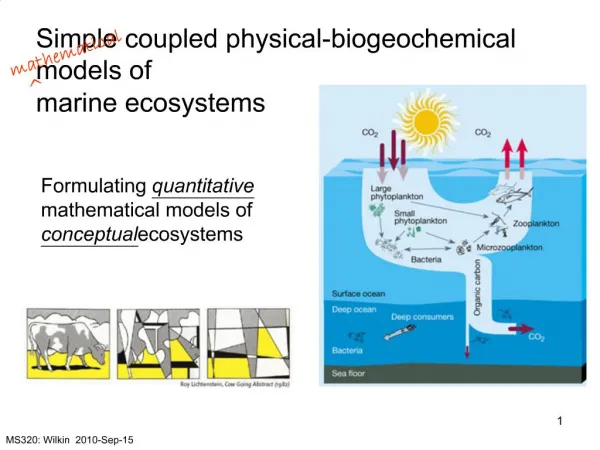
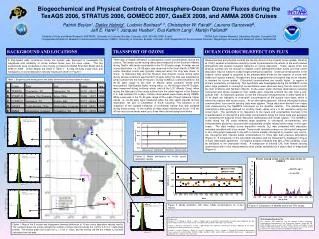
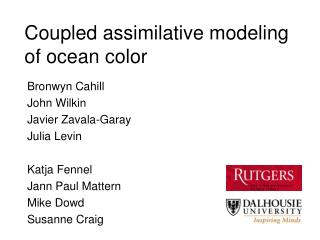
Coupled physical-biogeochemical modeling of the Louisiana Dead Zone Katja Fennel Dalhousie University katja.fennel@dal.ca Rob Hetland Texas A&M Steve DiMarco Texas A&M
Background • Preliminary results from ongoing NOAA project (lead: DiMarco; modelers: Hetland, Harris, Xu & Fennel); Focus on understanding interplay of physical, biological and geochemical processes that control hypoxia on the TX-LA shelf • Goals include: realistic physical-biogeochemical model for assessment of factors such as • physical environment/forcing (e.g. stratification, wind forcing) • benthic-pelagic coupling and sediment transport on hypoxic extent AND simulation of various scenarios • Strengthen predictive capabilities through quantitative understanding of mechanisms
Physical model: ROMS v3.0 • Resolution: 3-5 km horiz., 20 vertical layers • Forcing: 3-hourly winds; climatological surface heat and freshwater fluxes • River inputs: daily measurements of FW input by U.S. Army Corps of Engineers • Model reproduces the two dominant modes of circulation (summer and non-summer), weather-band variability and surface salinity fields (Hetland & DiMarco, J. Mar. Syst., 2007)
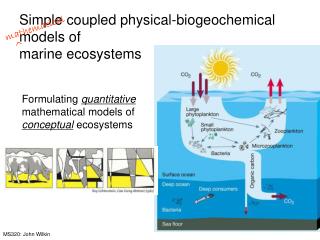
Nitrification Water column Mineralization NH4 NO3 Uptake Phytoplankton Grazing Chlorophyll Zooplankton Mortality Large detritus Susp. particles Nitrification N2 NH4 NO3 Denitrification Aerobic mineralization Organic matter Sediment Biological model: nitrogen cycling in water column and simplified sedimentary processes; oxygen coupled (Fennel et al., GBC, 2006) River inputs: USGS nutrients fluxes for Mississippi and Atchafalaya Current limitations: no explicit sediment (instantaneous remineralization), no sediment transport no P-cycle
Note differences between: • 1992 (low discharge, low N input), • 1993 (high discharge, high N input) and • 1994 (lower discharge, highest N input ).
1992: • low discharge • low N input • 1993: • high discharge • high N input • 1994: • lower discharge • highest N input
1992: • low discharge • low N input • 1993: • high discharge • high N input • 1994: • lower discharge • highest N input
Summary • Coupled physical-biogeochemical model reproduces many observed features • Physical variability • Surface chlorophyll distributions • Hypoxic area (size and spatial distribution) • Interannual variability is determined by the interplay of microbial and physical process • Important next step: inclusion of more realistic sediment (diagenesis, resuspension and transport)