Download
1 / 36
370 likes | 599 Views
Coupled Biogeochemical Cycles. William H. Schlesinger. Millbrook, New York. 1. Some basic stoichiometry for life―in biomass First articulated by Liebig (1840) and later advanced by Redfield (1958), Reiners (1986), Sterner and Elser (2002), and Cleveland and Liptzin (2007).

E N D
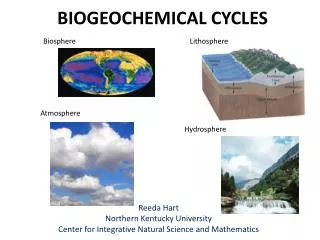
Coupled Biogeochemical Cycles William H. Schlesinger Millbrook, New York
1. Some basic stoichiometry for life―in biomass First articulated by Liebig (1840) and later advanced by Redfield (1958), Reiners (1986), Sterner and Elser (2002), and Cleveland and Liptzin (2007)
Complementary Models for Ecosystems Reiners, W.A. 1986
The Global Nitrogen Cycle - Modern <5 145 100 + ?Δ 121 48-59 40 18
IF NPP = 60 x 1015 g C/yr X 1015 g C x 1 N = 1.2 x 10¹⁵ g N 50 C = 1200 x 1012 g N/yr
Spatial Distribution of the 1990 Carbon Sink Resulting from Fossil-fuel N Deposition between 1845 and 1990 Townsend et al. 1996. Ecological Applications 6(3):806-814.
Coupling of biogeochemical cycles, due to: The flow of electrons in the oxidation/reduction reactions― First articulated by Kluyver (1926), and later advanced by Morowitz, Nealson, Falkowski, and many others
Table 1. Matrix of redox reactions via microbial metabolisms as updated and modified from Schlesinger et al (2011).
Coupled Metabolism & The Sulfur Wars Howarth and Teal 1979 report 75 moles/m2of sulfate reduction annually 2H+ + SO4= + 2CH2O 2CO2 + H2S + 2H2O implies150 moles of C is oxidized 150 mols C = 1800 g C/m2/yr Howes et al. 1984 NPP nowhere near that high!
The Global Nitrogen Cycle - Modern <5 145 100 + ?Δ 121 48-59 40 18
Denitrification 5CH2O + 4H+ + 4NO3- → 2N2 + 5CO2 + 7H20 Intermediates include NO and N2O
Hirsch et al. 2006 Hirsch et al. 2006
∆ N20 = Total N20 __________________ N2 + N20
Calculation of change in denitrification from N2O 124 Tg (0.37) + 110 Tg (0.082) = 234 Tg (0.246) 4 TgN2O/yr / 0.25 = 17 TgN/yr
The Global Nitrogen Cycle - Modern <5 150 +9 145 116-124 Land-sea Transport 48 121 48-59 40 18
3. Coupling of biogeochemical cycles to carbon through chelation
Fig. 2. The fractional amount of Pb loss calculated over the study period is significantly correlated with the thickness (cm) of the forest floor at each site. A logarithmic fit to these data give r2 = 0.65. Kaste et al. 2006.
Principles of coupled biogeochemical cycles apply to geo-engineering
For example, if we wanted to sequester a billion metric tons of C in the oceans by enhancing NPP with Fe fertilization Current marine NPP = 50 x 1015 g C/yr F-ratio of 0.15 means that 7.5 x 10¹⁵ g C/yr sinks through the thermocline An additional 1 x 10¹⁵ g C/yr sinking would require ~7 x 10¹⁵ g C/yr additional NPP, so 7 x 10¹⁵ g C x 23 x 10-6 Fe/C = 1.6 x 10¹¹ g Fe (Lab uptake), or x 6 x 10-4 = 4.2 x 10¹² (Field observation) Buesseler & Boyd (2003) Versus, the global production of Fe annually (1900 x 1012 g Fe/yr)
For example, to provide a sink for 1 x 10¹⁵gC/yr in the world’s soils by fertilizing them: Current terrestrial NPP = 50 x 1015 g C/yr Preservation ratio of 0.008; i.e., global NEP – 0.4 g C/yr (Schlesinger 1990) To store an additional 1.0 x 10¹⁵ g C in soils would require adding 125 x 1015 g C/yr to terrestrial NPP 125 x 1015 g C/yr x 1 N/50 C = 2.5 x 10¹⁵ g N as fertilizer each year 2.5 x 10¹⁵ g C @ 0.857 g C released as CO2 per g N = 2.14 x 10¹⁵ g C/yr released in fertilizer production
My final message today: There is an increasing role for biogeochemists to contribute to the understanding and fruitful solutions to global environmental problems.