Download

1 / 61
610 likes | 795 Views
Gender Inequality in Oregon Graduate Schools. A focused look at the data & social factors. Introduction. Part One: The Social Factors Discussed By Bree King Part Two: Quantitative Data From OR School Discussed By Dakota MacColl

E N D
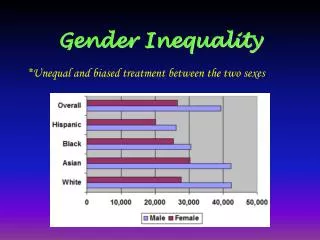
Gender Inequality in Oregon Graduate Schools A focused look at the data & social factors
Introduction • Part One: The Social Factors • Discussed By Bree King • Part Two: Quantitative Data From OR School • Discussed By Dakota MacColl • Part Three: Qualitative Data From Graduate Students & Professionals in OR • Discussed by Dakota MacColl • Part Four: An International Perspective • Discussed By Bella Harutyunyan
Acknowledging Bias • We are aware the data we have is not representative to the problem as a whole. • We are aware we are an all female group speaking on a topic of female oppression. However, the issue of gender imbalance as a presentation was started by a male group member that did not get to finish working on the project.
SHE ++ • http://sheplusplus.stanford.edu/film/ SHE++ is a short documentary that looks at women who are breaking the stereotype and entering a male dominated occupations in technology, engineering and more. The film was directed by two female technologists from Stanford.
Why SHE ++ • It directly discusses women in STEM occupations • It addresses the gender stereotypes we found in our research • It shows women breaking the gender stereotype • It offers several positive suggestions on what needs to change and how?
Social Factors An in depth look at social factors and influences
What are the factors? • Culture • Family Structure • Childhood Education • Social Influences • Educational Environment • Religion • Peers/ Colleagues • Work Place Source: International Journal of Sustainable Development, Vol. 05, No. 05 (2012)
Stereotypes created by society Bread winner Care giver Typically Female More likely to be in jobs that care for others Pink Collar Nursing, Social Work, Office setting jobs • Typically Male • More likely to be in high • paying jobs • Blue Collar • Corporate, STEM, Hard Labor jobs Source: British Journal of Developmental Psychology (2011)
What Is Stem? • Science • Technology • Engineering • Mathematics Source: U.S. Department of Commerce, Women in STEM: A Gender Gap to Innovation (2011)
Factors affecting women in stem • A Lack of Female Role Models • Gender Stereotyping • Less Family-Friendly Flexibility Source: U.S. Department of Commerce, Women in STEM: A Gender Gap to Innovation (2011)
The Facts: Women in stem • Less than 25% of women hold jobs in STEM fields. • Women in STEM jobs earn 33% more than non-STEM job holders. • Women have a low share in STEM undergraduate degrees. Source: U.S. Department of Commerce, Women in STEM: A Gender Gap to Innovation (2011)
What is the Gender Gap? • The differences in the outcomes amongst men and women’s achievements in the professional career industry. Source: Claudia Goldin, Library of Economics and Liberty
What is the family gap? • “The wage differential between women with and without children.” • Source: Jane Waldfogel, Understanding the “Family Gap” in pay for Women with Children. (1998)
What is Blue Collar versus Pink Collar? • The idea of segregated male and female jobs • Normally falls under a stereotype
Blue Collar PINK COLLAR • Doctor • Corporate Executive • Professor • Mechanic • Nurse • Office Assistant • Teacher • Customer Service
Study showing influences on matriculation • A study within a college student journal in the early 2000’s was conducted that looked at reasons as to why students persistence was continued or stopped. • This study offers suggestions as to how we can help students continue their education. • “It is well documented that one of the most important aspects of student retention lies in the commitment of integrating students into the social communities of an institution.” (Rosenthal, 1995; Tinto, 1993)
Influences on Students’ Persistence • Family Encouragement 95% Agreed 05% Disagree • Positive Relationships With Professors 90% Agreed 09% Disagree • Positive Course Experiences Within My Major 86% Agreed 13% Disagree • Recreational Facilities 83% Agreed 15% Disagree • Desired Social Status Among Colleagues 82% Agreed 17% Disagree • Status of Friends (Bandwagon) 79% Agreed 20% Disagree Source: Perceptions of College Students On Social Factors That Influence Student Matriculation
Discouraging Student Persistence • Too many school-related responsibilities 57% Agreed 40% Disagree • Lack of time management skills 52% Agreed 47% Disagree • Inability to handle stress 52% Agreed 47% Disagree • Negative experiences with other students 50% Agreed 48% Disagree • Being away from family members 44% Agreed 54% Disagree Source: Perceptions of College Students On Social Factors That Influence Student Matriculation
Why does this matter? • How do genders handle these social influences differently? • Could we help change this? • How is our education system helping to form these influences? • What can we do differently?
The hard Facts A critical look at the revealing data
Intro: OHSU • This school involves STEM • Fact Book • Local: OR • Assumption we would find extremely different numbers of men and women enrolled in certain programs
Findings • In 2013, women made up 56.2% of total enrollment at the school of medicine • Counter argument: Since there’s more women, things are okay.
Findings • In 2013, men only made up 16.8% of the total enrollment at the school of nursing • Started off looking at fields with not a lot of women, found fields with not a lot of men • Led us to interviews with professionals in that field
Intro: OSU • Wide variety of graduate programs • Enrollment Summary for Spring 2014 • Difference in numbers between 2013 and 2014 for males and females • Shows the programs with the highest numbers for males and females • Local: OR • The assumption was that more males than females are enrolled at OSU.
OSU Graduate program enrollment by gender: • In 2013: • Men: 1,946 • Women: 1,718 • In 2014: • Men: 2,046 • Women: 1,764
OSU Programs with higher number males: • Engineering = • 2013: 813 2014: 788 • Science = • 2013: 242 2014: 234 Business Administration = 2013: 185 2014: 190 Programs with higher number of females: • Graduate School = • 2013: 433 2014: 377 Education = 2013: 201 2014: 200 Public Health and Human Sciences = 2013: 195 2014: 190
Findings • There are programs with more men than women, but there are also programs with more women then men. • More men are enrolled at OSU than women. Men make up 53.2% of the enrollment while women are 46.8%.
Interviews A personal Look: Qualitative data
Graduate student interviews • The participants for the graduate student interviews were a forestry student (MFS), 2 engineering students (MES and Alyssa), and a geology student (Adonara). • Students were found by contacting the head of the respective departments and asking if there would be any willing participants for our interviews • Both males participants provided answers, but asked to remain anonymous. The females gave answers and permission for their name to be used. • Chose to interview males and females for both perspectives • These interviews are not a representation of the whole population.
Questions Asked • Do you see a difference in number of people of a certain gender in your program? If so, why do you think that is? Do you think gender role stereotypes contribute to this? • Do you think gender equality is important in your program? Why or why not? • What are your beliefs about gender performance? For example, do you think that there are certain jobs that are better done by men than women? • Do you believe that gender roles are still deeply institutionally and socially rooted in the workplace? Why do you think that is? Does that worry you? • Do you believe that there are certain resources that would help this process? What would they be and why do you think they would help?
Highlights from Graduate Student Interviews • Difference in numbers? • MES: Far more men than women, believes it’s from lack of interest from women and discouragement from academic advisors • Alyssa (Engineering): Gender disparity is very noticeable
Highlights from Graduate Student Interviews • Gender performance? • MFS: Believes that because men and women are biologically different they will gravitate toward different paths in life and be more successful at them • Importance of gender equality? • All students agreed that gender equality within their respective programs is extremely important
Highlights from Graduate Student Interviews • Resources? • MFS: Start teaching about gender roles in the home • Alyssa (Engineering): Believes presence of mentors is an important resource to students • Adonara (Geology): Society must change or resources won’t be of much help • Gender roles? • Alyssa (Engineering): Believes sexism and gender roles are deeply socially and institutionally rooted within education and the work place
Interviewing Professionals • Qualitative data – not representative of the whole population • Personal experience is meaningful and powerful • Male and Female Perspectives • In Sociology, Interviews are an accepted methodology of research for qualitative data
Professionals Interviewed • Colleen O’Connell • BSN Registered Nurse (Bachelor of Science in Nursing) • Nurse Manager at the surgical inpatient unit at PeacehealthRiverbend in Springfield, OR
Professionals Interviewed • Chris Webb • Physician Assistant at PeacehealthRiverbend Hospital in Springfield, OR
Questions Asked • Do you see a difference in a number of people of a certain sex in your field? Why do you think that is? Do you think it has anything to do with gender stereotypes? • What do you think we can do to get more members of the opposite sex in your field of work? • What are your experiences with gender performance stereotypes in the workplace? Do you see or deal with people that believe certain jobs are better done by a man than a women? How do you handle those situations?
Highlights from Professional Interviews • Difference in numbers? • Colleen (RN): Absolutely, definitely a gendered and female dominated field. It’s about 80% women, 20% men. • Chris (PA): Statistically, yes. In the workplace, it’s about the same. • “Women will gravitate toward RN and PA jobs and men will tend to gravitate towards medicine.” • Flexibility, ability to take time off of work for children.
Highlights from Professional Interviews • Gender stereotypes causing inequality? • Colleen (RN): Hear a lot of “Mom was a nurse, sister was a nurse,” but not much of “Dad was a nurse, uncle was a nurse.” • Start breaking down these stereotypes at a young age with children’s literature. • Dealing with gender stereotypes? • Sensitivity training is provided by the hospital for both males and females. • Both mentioned that they see this and it can be understandable due to the nature of the professions they work in. • Colleen noted seeing it much more frequently than Chris.
Highlights from Professional Interviews • Is there a need for the opposite sex in your field? Why? • Colleen (RN): Yes. Having a diverse work force allows for better care of patients. • Community outreach. • High school outreach. • Smaller, more diverse Instructor pools. • Can’t happen on it’s own. • Definitely needs an outside push.
International Perspective A different approach to gender inequality
Out of the 900 million illiterate adults on the planet, 2/3 are women. Half of the world's food is produced by women, but they only own 1% of the farmland Only 15% of the elected legislatures in the world are female.
Facts about Saudi Arabia • Female literacy is estimated to be at 50% and male literacy at 72% (UNDP,2003) • Adult illiteracy for the population 15 to 24 years of age for 2015 is 2.9% for women and 2.7% for men (UNESCO)
Historical facts • Women's schooling at all levels remained under the Department of Religious Guidance until 2002 • The education of men was overseen by the Ministry of Education • Share of budget appropriations for women’s education is only 18% of that for men • More than 34% of men teaching at men’s universities hold doctorates compared to only 3% of those who teach at women’s universities and colleges (AlMunajjed, 1997)
Progress • The number of women’s institutions has grown from 15 in the 1960s to 155 in the 1970s (Al Mohsen, 2000) • The first university to have a women‘s campus was Riyadh’s King Saud University, opened in 1979 (subject areas: Arabic, English, history and geography) • In the 1980s women’s campuses at King Saud University added colleges for public administration, medicine, dentistry, nursing, education
American Presence • The American presence in Saudi Arabian society began with the production of oil in 1979 and the establishment of ARAMCO (Arabian American Oil Company) • Foreign migrant labor accounted for 43% of total workforce in oil companies in the mid 1970s