Download
1 / 10
100 likes | 204 Views
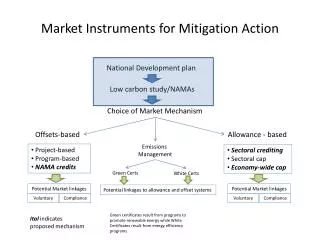
This analysis explores the implementation of environmental taxes and related transfers worldwide, examining their impact on society and the environment. Key indicators, examples, and data requirements are outlined, with a focus on the policy implications of such instruments. The significance of phasing out environmentally damaging subsidies is also discussed, aligning with G20 commitments. Government budget data, national accounts, and micro-level payment information are utilized for comprehensive assessments. Contact viveka.palm@scb.se for more information.

E N D
Analysis of market based instruments for the environment Viveka Palm Head of Unit, Environmentalaccounts and Naturalresources, SCB Adjunct professor, KTH 2012-06-11
SEEA Volume 3: Applications and extensionsTaxes and environmentally related transfers Australian Bureau of Statistics: Nancy Steinbach and Lilina Feng Statistics Sweden: Viveka Palm
Outline • 1. Description- highlight the key indicators and present examples of tables or graphs.2. Policy and analyticalrelevance3. Overview of steps and data requirements4. Links to relevant technicaladvice / theory and links to specificexamples.
EnvironmentalTaxes • There are a range of countries around the world which have implemented environmental taxes. It is important to understand the use of the taxes, their social implications and their impact on the environment. • §4.150 of the SEEA central framework 2012 define an environmental tax as a tax whose tax base is a physical unit (or a proxy of it) of something that has a proven, specific, negative impact on the environment.
Environmental tax revenue by type, EU-27, 1995-2009 (EUR and % GDP)
Distribution of CO2 tax revenues, emissions rights, CO2 emissions covered by the trading scheme and total CO2 emissions in Sweden by Industry (NACE)
Otherenvironmentalrelated transfers TablesshowingImplicit subsidies Environmentalmotivated transfersEnvironmentallydamaging subsidies from Australia, Netherlands and Denmark
Policy and analyticalrelevance • The G20 leaders in 2009 agreed to phase out subsidies that “encourage wasteful consumption, reduce our energy security, impede investment in clean energy sources and undermine efforts to deal with the threat of climate change”. • OECD and IEA are contributing to the follow-up on this commitment by the G20 (see e.g. Inventory of Estimated Budgetary Support and Tax Expenditures For Fossil Fuels, 2011).
Overview of steps and data requirements • Cross classify National Accounts data on subsidies, social benefits, transfers etc. to environmental purpose; • An analysis of government budget lines and/or annual statements (realizations) of relevant government agencies; • Micro data concerning actual payments of transfers