Download
1 / 1
10 likes | 167 Views
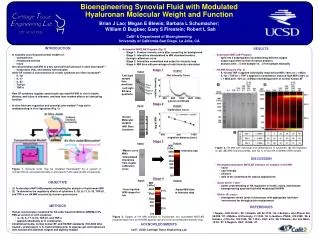
Bioengineering Synovial Fluid with Modulated Hyaluronan Molecular Weight and Function Brian J Lao; Megan E Blewis; Barbara L Schumacher; William D Bugbee; Gary S Firestein; Robert L Sah Calit 2 & Department of Bioengineering University of California-San Diego, La Jolla, CA.

E N D
Bioengineering Synovial Fluid with Modulated Hyaluronan Molecular Weight and Function Brian J Lao; Megan E Blewis; Barbara L Schumacher; William D Bugbee; Gary S Firestein; Robert L Sah Calit2 & Department of Bioengineering University of California-San Diego, La Jolla, CA MW [ kDa ] MW [ kDa ] 5000 5000 3000 3000 1000 1000 500 500 300 300 Output: 100 100 • Automated MATLAB Program (Fig. 2) • - Stage 1: Creates intensity curve after correcting for background • - Stage 2: Intensities standardized to MW standard markers • through calibration curve • - Stage 3: Intensities normalized and output to intensity map • - Stage 4: MW bins with percentage of total intensity calculated • INTRODUCTION • In naturally occurring and animal models of: • - osteoarthritis • - rheumatoid arthritis • - injury • the concentration and MW of a key synovial fluid lubricant is often decreased1-3 • - hyaluronan (HA), secreted by synoviocytes while SF volume & concentration of certain cytokines are often increased4-7 - IL-1β - IL-17 - IL-32 - TGF-β1 - TNF-α • How SF cytokines regulate synoviocyte-secreted HA MW in vivo in health, • disease, and injury is unknown, and may have marked affects on lubricating • function • In vitro lubricant regulation and synovial joint models8,9 may aid in • understanding in vivo regulation (Fig. 1): • OBJECTIVE • (1) To develop a MATLAB program automating the analysis of hyaluronan MW • (2) To determine the regulatory effects of cytokines IL-1β, IL-17, IL-32, TGF-β1, • and TNF-α on HA MW secreted by human synoviocytes • METHODS • Human synoviocytes incubated for 3d under basal conditions (DMEM+0.5% • FBS as control) or with cytokines • IL-1β, IL-17, IL-32, TGF-β1, and TNF-α • applied individually or in combination • Conditioned media, normal human SF, and HA MW standards (160-4000 kDa) • treated + proteinase K ± S. hyaluronidase prior to agarose gel electrophoresis • Gels stained with Stainsall reagent and digitally imaged • RESULTS • Automated MATLAB Program • - split into 4 subprograms encompassing different stages • - output equivalent to that of manual analysis • - analysis time:~5 min/sample vs. ~2 hrs/sample manually • HA MW Analysis (Fig. 2) • - IL-1β and TNF-α applied individually induced low-MW (>60% at < 1 MDa) • - IL-1β + TGF-β1 + TNF-α applied in combination induced high-MW (>60% at • > 1 MDa and ~40% at >3 MDa) resembling profile of normal human SF • Added MW bins to Intensity map Output: Input: Stage 1 • Net Intensity Curve • Left/right sample lane positions 12 relative intensity • xfinal 8 • xinit • Left/right BG lane positions • xbgfinal 4 • xbginit 0 1800 200 600 1000 1400 • Calibration Curve y-pixel coordinate Output: Input: Stage 2 4 log of MW 3 y = -0.001589x + 4.372577 2 • Known Molecular weights • MW Pixel Locations 1 1400 400 migration distance [mm] 900 1400 Output: Input: Stage 3 Figure 3. HA MW with individual and combinations of cytokines: (A) HA migration on gel, (B) MW intensity profiles, and (C) % of total HA in different MW ranges. • Master curve MWs • Interpolated intensities from master calibration curve • Intensity map • DISCUSSION • Developed automated MATLAB interface for analysis of HA MW • - novel • - user-friendly • - efficient • - able to be customized for special applications • Goals within 1 year - • - better understanding of HA regulation in health, injury, and disease • - bioengineering synovial fluid with modulated HA MW • Within 10+ years - • - bioengineer whole joints in bioreactor with appropriate lubricant • environment for biological joint replacement • REFERENCES • 1 Teeple+ JOR, 26:231, ‘08. 2 Elsaid+ AR, 52:1746, ‘05. 3 Belcher+ Ann Rheum Dis, 56:299, ‘97. 4 Marks+ Arthroscopy, 21:1342, ’05. 5 Joosten+ PNAS, 103:3298, ’06. 6 Kotake+ J Clin Inv, 103:1345, ’99. 7 Wei+ OAC, 6:10, ’98. 8 Blewis+ Eur Cell Mater, 13:26, ’07. 9 Nugent+ OAC, 15:566, ’07. Figure 1. Synovial joints may be modeled theoretically8 by a system of compartments, and experimentally in a bioreactor9 with appropriate components. Input: Stage 4 • User inputted MW ranges for bin 61% 16% 23% Figure 2. Stages of HA MW analysis to incorporate into automated MATLAB program begin from an HA MW agarose gel and finish at normalized intensity map. ACKNOWLEDGMENTS Calit2, UCSD, Cartilage Tissue Engineering Lab