Download
1 / 52
520 likes | 705 Views
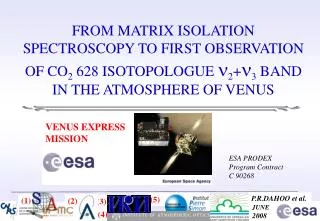
VENUS EXPRESS MISSION. FROM MATRIX ISOLATION SPECTROSCOPY TO FIRST OBSERVATION OF CO 2 628 ISOTOPOLOGUE 2 + 3 BAND IN THE ATMOSPHERE OF VENUS. ESA PRODEX Program Contract C 90268. (1,5) P. R. Dahoo , Jean-Loup Bertaux, F. Montmessin, E. Villard (SA-France).

E N D
VENUS EXPRESS MISSION FROMMATRIX ISOLATION SPECTROSCOPY TO FIRST OBSERVATION OF CO2 628 ISOTOPOLOGUE 2+3 BAND IN THE ATMOSPHERE OF VENUS ESA PRODEX Program Contract C 90268
(1,5)P.R. Dahoo, Jean-Loup Bertaux, F. Montmessin, E. Villard (SA-France) FROMMATRIX ISOLATION SPECTROSCOPY TO FIRST OBSERVATION OF CO2 628 ISOTOPOLOGUE 2+3 BAND IN THE ATMOSPHERE OF VENUS (2)Ann Carine Vandaele, Valérie Wilquet, A. Mahieux (IASB-Belgium) (3) O. Korablev , A. Fedorova & (4)V.I. Perevalov and S.A. Tashkun (IKI-IAO-Russia) ack:*G. L. Villanueva & Michael J. Mumma(NASA-US)
OBSERVING CO2 ON VENUS FROM SPACECRAFT FROMMATRIX ISOLATION SPECTROSCOPY TO FIRST OBSERVATION OF CO2 628 ISOTOPOLOGUE 2+3 BAND IN THE ATMOSPHERE OF VENUS OBSERVING CO2 IN A MATRIX ANALYZING OBSERVED SPECTRA PLAN OF THE TALK : 3 PARTS
OBSERVATION OF CO2 628 ISOTOPOLOGUE2+3 BAND IN THE ATMOSPHERE OF VENUS PART 1: OBSERVING CO2 ON VENUS FROM SPACECRAFT
Interplanetary Transfer Orbit : Venus Express spacecraft FINAL OPERATIONAL ORBIT ON THE 7th MAY 2006. 7 INSTRUMENTS ON BOARD SPICAV/SOIR From launch till Venus capture.
SPICAV on Venus Express SPICAV an ACRONYM for: SPectroscopy for the Investigation of the Characteristics of the Atmosphere of Venus Consists of three spectrometers in the UV and IR range with a total mass of 13.9 kg flying on the Venus Express (VEX) orbiter. Devoted to the study of the atmosphere of Venus from ground level to the outermost hydrogen corona at more than 40,000 km.(SPICAV P.I. JL BERTAUX)
SPICAV on Venus Express: Three spectrometers to study the global structure and composition of the Venus atmosphere Characteristics of the spectrometers
OBSERVATION PHASE: DIFFERENT MODES INCLUDES: Nadir pointing - preferably during pericentre pass, but possible on any portion of the orbit; VIRTIS, PFS, SPICAV and VMC may operate in this mode Limb observation - VIRTIS, PFS, SPICAV and VMC may operate in this mode Star occultation (SPICAV) &(SPICAV/SOIR) Radio science (VeRa) DEPENDS ON: 1) PAYLOAD CONFIGURATION & 2)SPACECRAFT ORIENTATION
The SOIR spectrometer is a new solar occultation IR spectrometer in the range λ=2.2–4.3 μm, with a spectral resolution λ/Δλ>15,000, the highest on board VEX (IASB Contribution). Simplified optical scheme of SOIR Includes a combination of an echelle grating and an AOTF crystal to sort out one order at a time & array Detector.
Comparison of Earth atmosphere transmission model with SOIR data for order 133 (TEST MODE ground base) Top: red curve- spectrum A typical read-out, recorded in spectrometer order 133. Bottom: black – model of Earth atmosphere, green—CH4 only, blue—H2O only. Adopted resolving power for the synthetic spectra is 20,000.
SOIR : Solar Occultation in the Infra Red. HOW ? VENUS ATMOSPHERE IS A HUGE ABSORPTION CELL WITH THE SUN AS LIGHT SOURCE FOR SPICAV-SOIR • Programming a solar occultation means, VEX is oriented with Solar entry ports for all three spectrometers of SPICAV to the Sun. • Solar spectra recorded by SOIR: • first above the atmosphere • then through the atmosphere
SPECTRUM OBSERVED IN THE 3 micron REGION 95 km to 70 km (120 km to 60 km) ASYMMETRIC SPECTRAL STRUCTURE ALWAYS OBSERVED NEAR 2982 cm-1 Bertaux, J.L., Vandaele, A.C., Wilquet, V., Montmessin, F., Dahoo, R., Villard, E., Korablev, O., Fedorova, A.,. Icarus 195 (1), 28–33 (2008).
METHOD TO ANALYZE SPECTRUM HITRAN : FAMOUS ONE OF COURSE GEISA DATA BASES CDSD: CO2 BUT ALSO INFORMAL DISCUSSION SPECTROSCOPISTS EXPERIMENTAL THEORETICAL
HCl SPECTRUM QUICKLY IDENTIFIED AND SIMULATED SEARCH FOR METHANE OR A CH BOND RESONANCE ABSORPTION POSSIBLE CO2 WENT UNNOTICED FOR ABOUT 6 MONTHS FROM FIRST OBSERVATION
Transmission due to CO2 calculated for a solar occultation through the Venus atmosphere Tangent height of 80 km • All isotopologues of CO2, • The main isotopologue 12C16O16O, • 12C16O18O. • Line parameters are from the CDSD-1000 database. • The box delimits the wavenumber range for diffraction orders 132 and 133, and the thick line indicates the wavenumber range of the 01111-00001. Wilquet V, Mahieux A, Vandaele AC, Perevalov V, Tashkun S, Fedorova A, Montmessin, F., Dahoo, R., and Bertaux, J.L.,. JQSRT 109, 895–905 (2008)
SPECTROSCOPY TO IDENTIFY CO2 628 ISOTOPOLOGUE DATA BASES MISS OBSERVED TRANSITION NEXT STEP:SEEKING FOR EXPERIMENTAL DATA!!
SEEKING FOR EXPERIMENTAL DATA SPECTROSCOPY TO IDENTIFY CO2 628 ISOTOPOLOGUE PART 2: OBSERVING CO2 IN A MATRIX
MATRIX ISOLATION TECHNIQUE SPECIES STABLE IN MATRIX SPECTROMETER KBr WINDOW SHIELD KBr WINDOW SAMPLE HOLDER GAS INLET (1) GAS INLET (2) PUMP MAINLY IMPULSED BY GEORGES PIMENTEL (1950) ISOLATE IN INERT MATRIX AN UNSTABLE CHEMICAL SPECIES FOR SPECTROSCOPIC STUDY GASMIXTURE COLD WINDOW SAMPLE SPECTROSCOPIC STUDY UV-IR-MICRO WAVE
Infrared absorption spectrum of CO2 in solid argon ISOTOPOLOGUES -Splitting of ν2 mode in double site -2 Trapping sites (S1 & S2) Dahoo, Teffo et al 1999 (M/R = 1000, T = 5 K, resolution = 0.15 cm−1)in the 2 bending and 3stretching region (1 = stable site; 2 = unstable site)a = 626,b = 627, c = 628, d = 727, e = 728).
SEEKING FOR EXPERIMENTAL DATA From recent work on CO2 and matrix effect on isotopologues to identification of 628 absorption?
CONSTRAINT ON ROTATION THROUGH INTERACTION WITH MATRIX Potential energy of the trapped molecule-matrix system The vibrational part of the interaction potential dependence in terms of normal coordinates {Q} An orthogonal transformation is applied to the transformed Hamiltonian of the vibrating trapped molecule
CONTACT TRANSFORMATION Hψ=Eψ Compute energy levels by solving the resulting Schrödinger equation, using contact* transformation perturbation technique*as for gas phase (from the renormalized hamiltonian of the molecule in the matrix) [*] J. H. Van Vleck, Phys. Rev. 33, 467 (1929) [*]H. H. Nielsen, Phys. Rev. 60, 794 (1941);Rev. Mod. Phys. 23, 90 (1951)
VIBRATIONAL ENERGY LEVELS CALCULATIONS: NO ROTATION (EASIER) Don’t Forget RESONANCES !! DIAGONALIZING Dahoo et al: 2006
CALCULATING VIBRATIONAL LEVELS OF CO2 628 ISOTOPOLOGUE ABSORPTION Vibrational levels calculations of 628 match observation for band center SIMULATE VR Spectra WITH B, D and H Dahoo et al: 2006 * J.L. TEFFO “SUPER” Ph.D Thesis (Doctorat D’Etat) 20/06/1990
FROMMATRIX ISOLATION SPECTROSCOPY TO IDENTIFICATION OF CO2 628 ISOTOPOLOGUE ABSORPTION AT 3.35 microns FINAL STEP PART 3: ANALYZING SOIR SPECTRA
IR SPECTRUM : SELECTION RULES PERPENDICULAR BAND VIBRATION ROTATION SPECTRUM LINEAR MOLECULES : XYZ G. AMATUPMC
1) The feature located at 2982 cm‑1 looks like a Q branch with R lines at higher and P lines at lower wavenumbers. OBSERVED SPECTRUM 2) They were located in the 2930-3015 cm‑1 spectral range, which correspond to four successive orders of diffraction of the instrument
SPECTROSCOPY TO IDENTIFY CO2 628 ISOTOPOLOGUE THIRD STEP:SPECTROSCOPISTS FOR THEORETICAL OR LABORATORY WORK FOR PRECISION
Transmission due to CO2 for a solar occultation through the Venus atmosphere • Diffraction order 132: • Regularly spaced P lines • Q branch due to light pollution from adjacent order • HCllines present.( asterisk). Records of SOIR in the 2950-2997 cm‑1 spectral domain. Wilquet et al.. JQSRT 109, 895–905 (2008)
Transmission due to CO2 for a solar occultation through the Venus atmosphere (B) Diffraction order 133 Q branch & R lines HCl lines ( asterisk) Records of SOIR in the 2950-2997 cm‑1 spectral domain.
CACULATIONS BY S. TASHKUN • Diffraction order 132 • SIMULATION • Regularly spaced P lines & • Lines due to HCl Wilquet V, Mahieux A, Vandaele AC, Perevalov V, Tashkun S, Fedorova A, Montmessin, F., Dahoo, R., and Bertaux, J.L.,. JQSRT 109, 895–905 (2008).
CACULATIONS BY S. TASHKUN (B) Diffraction order 133 SIMULATION Q branch & R lines Lines due to HCl Wilquet V, Mahieux A, Vandaele AC, Perevalov V, Tashkun S, Fedorova A, Montmessin, F., Dahoo, R., and Bertaux, J.L.,. JQSRT 109, 895–905 (2008).
SAME IDENTIFICATION ON MARSFor 628 & also for 638 and 627G.J.Villanueva & M. Mumma et al.Icarus 195 (1)(2008) & J.Q..S.R.T. 109 (2008) 883–894
NIRSPEC spectra of the newly discovered band system of CO2 (628) on MARS. This spectral region is one of the prime search spaces for CH4 (methane) and C2H6 (ethane). The discovery of this 628 band is of high importance for assessing spectral confusion between these species. Geronimo L. Villanueva,, Michael J. Mumma, Robert E. Novak & Tilak Hewagama Icarus 195 (1)(2008), 34–44J.Q..S.R.T. 109 (2008) 883–894
A Glance at band system of CO2 (638) identified on MARS. HOW ABOUT 638? QUOTING: * The identification of the 2ν1 band of 638 is tentative. Little is known about the vibrational structure of this isotope The upper vibrational state (20001) has not been catalogued in the literature. Rothman el al. ** report spectroscopic constants for the (Fermi resonant) 20002 vibrational level at Gv= 2588.152 cm−1. *Villanueva, G. L., Mumma, M. J., Novak, R. E., Hewagama, T. Icarus 195, 34–44 (2008) **JQSRT 48 (1992), pp. 537–566
NIRSPEC spectra of the newly discovered band system of CO2 (638) on MARS. Two hypothesis by Villanueva et al. First hypothesis, the lines in the 2706–2720 cm−1 region correspond to the P-branch. BUT !! Expected R-branch lines in the 2730–2740 cm−1 region are not detected. Villanueva, G. L., Mumma, M. J., Novak, R. E., Hewagama, T. Icarus 195, 34–44 (2008)
NIRSPEC spectra of the newly discovered band system of CO2 (638) on MARS. Second hypothesis : detected lines correspond to the R-branch of the 638 2ν1 band system. The band center is lower than 2706 cm−1. The intensity distribution peaks at 2710 cm−1, which for a column temperature of 207 K would mean a band center at 2700.5 cm−1. Villanueva, G. L., Mumma, M. J., Novak, R. E., Hewagama, T. Icarus 195, 34–44 (2008)
NIRSPEC spectra of the newly discovered band system of CO2 (638) on MARS. CALCULATIONS FOR 638 * 20001 : 2701.956 cm-1 20002 : 2588.192 cm-1 20003 : 2467.445 cm-1 CONCLUSION The intensity distribution peaks at 2710 cm−1, which for a column temperature of 207 K and the band center is at 2700.5 cm−1 (experimental). * J.L. TEFFO “SUPER” Ph.D Thesis (Doctorat D’Etat) 20/06/1990
FUTURE OBSERVATIONS MARS EXPLORATION ON 2013 BY ESA SUBMISSION OF PROJECTS WELCOMED FROM EUROPE & FROM US TOO
THANKS TO LINEAR MOLECULES Professor G AMAT L HENRY A HENRY M MARGOTTIN OTHERS TOO!!
OBSERVED & SIMULATED SPECTRUM THANK YOU FOR ATTENTION !!
Echelle grating & Detector With 4 grooves per mm the arctan(2) incidence-grating SOIR spectrometer operates on diffraction orders from 101 (4.4 μm) to 194 (2.3 μm). The SOIR optics pass the filtered and dispersed light to a photo-voltaic MCT (HgCdTe) detector in an Integrated Detector Dewar Cooler Assembly (IDDCA). The detector is arranged as a 320×256 array of 30 μm square pixels. The IDDCA is equipped with a 0.4 Watt Stirling cycle rotary microcooler.
The SOIR optics pass the filtered and dispersed light to a photo-voltaic MCT (HgCdTe) detector contained in an Integrated Detector Dewar Cooler Assembly (IDDCA). The detector is arranged as a 320×256 array of 30 μm square pixels. The IDDCA is equipped with a 0.4 Watt Stirling cycle rotary microcooler.
EXPERIMENTAL RESULTS SPECTRUM SIMPLIFIED NO ROTATION OPTICAL THICKNESS FAVOURABLE FOR OBSERVATION BUT MATRIX DEPENDENT FEATURES FEW LINES - SHIFTED ONLY MOST INTENSE COLD BANDS ABSORBING REMARK! OBSERVATION OF OVERTONES AND COMBINATION BANDS FROM EMISSION (INDIRECT WAY) LASER INDUCED FLUORESCENCE
VIBRATIONAL LEVELS OF CO2 628 ISOTOPOLOGUE AND SELECTION RULES G. AMATUPMC LABELLING OF LEVELS
IR SPECTRUM : SELECTION RULES LINEAR MOLECULES : XYZ G. AMATUPMC PARALLEL BAND ALLOWED TRANSITIONS VIBRATION ROTATION SPECTRUM PERPENDICULAR BAND
ANALYSIS OF EXPERIMENTAL RESULTS MODELLING REQUIRES Modelling of matrix effect on vibrational energy states to calculate energy levels QUESTIONS ? 1) WHAT ARE THE POSSIBLE TRAPPING SITES 2) IN WHAT LATTICE (fcc , hcp, mixed..) 3) HOW DOES THE MATRIX PERTURB THE ELECTRONIC POTENTIAL DRIVING THE VIBRATION OF THE NUCLEÏ MOST IMPORTANT
POTENTIAL ENERGY CO2/Ar Double Site C2 MOLECULE IN MATRIX MOLECULE IN MATRIX MOLECULE IN MATRIX MOLECULE IN MATRIX NECESSARY TO MODEL MATRIX EFFECT ON OXIDES NECESSARY TO MODEL MATRIX EFFECT ON OXIDES NECESSARY TO MODEL MATRIX EFFECT ON OXIDES NECESSARY TO MODEL MATRIX EFFECT ON OXIDES DOUBLE SITE C2 SYMMETRY AXIS DOUBLE SITE C2 SYMMETRY AXIS DOUBLE SITE C2 SYMMETRY AXIS DOUBLE SITE C2 SYMMETRY AXIS SINGLE SITE C4 SYMMETRY AXIS SINGLE SITE C4 SYMMETRY AXIS SINGLE SITE C4 SYMMETRY AXIS SINGLE SITE C4 SYMMETRY AXIS Energy (cm-1) CO2 : Ar- 2 SITES (Single and Double) Kr et Xe -1 SITE (Single) fccLattice