Download
1 / 17
170 likes | 297 Views
Approaches for establishing links among ecological and chemical status. Outline: Introduction – WFD Annex V – how to quantify? What has the REBECCA project given? Examples of dose-response functions relating ecological and chemical elements How to use automated methods?.

E N D
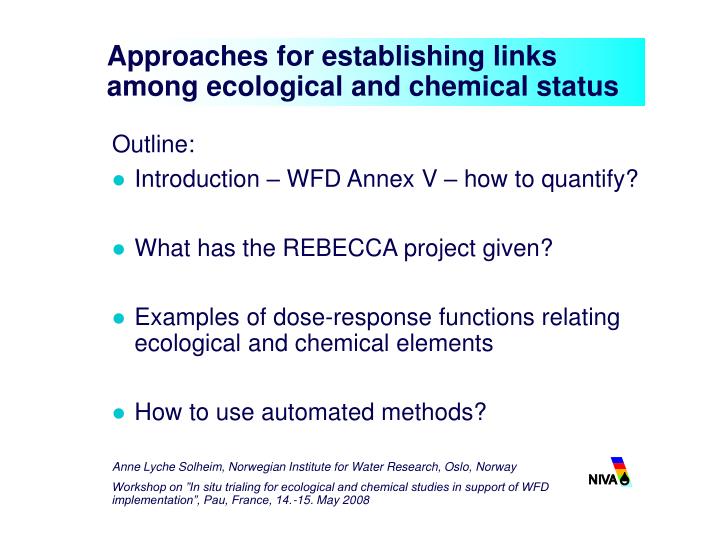
Approaches for establishing links among ecological and chemical status Outline: • Introduction – WFD Annex V – how to quantify? • What has the REBECCA project given? • Examples of dose-response functions relating ecological and chemical elements • How to use automated methods?
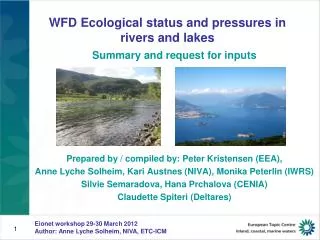
Introduction – WFD Annex V – how to quantify? • Monitoring of chemical elements has dominated classification systems before WFD • Eutrophication/organic pollution: P, N, BOD, COD, O2 • Acidification: pH, ANC, Al • Toxic substances: metals, POPs • WFD require monitoring of biological elements • Phytoplankton, benthic algae, macrophytes, benthic fauna, fish • Links between biological and chemical elements needed for river basin management plans • Challenge to develop classification systems with biological indicators and class boundaries in line with Annex V normative definitions • Challenge to obtain type-specific relationships between chemical and biological indicators for different pressures
What has the REBECCA project given? • REBECCA: Relationships between ecological and chemical status of surface waters • EU FP 6 project: 2004-2007 • Constructing relationships based on existing data • Lakes, rivers and coastal waters included • Eutrophication, acidification, toxic substances and hydromorphological pressures included • Publications: • Lakes results published in Aquatic Ecology (May 2008) • Rivers results will be published in Freshwater Biology (autumn 2008) • Coastal results published in different marine biology journals • Final conference in Oslo in May 2007 • All reports and presentations available at www.rbm-toolbox.net
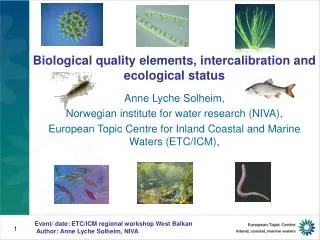
REBECCA dataset for Lakes Largest Pan-European dataset ever: >5000 lakes (Moe et al. 2008)
Examples of dose-response functions relating ecological and chemical elements • Lakes: • Phytoplankton and nutrients • Macrophytes and nutrients • Rivers: • Benthic invertebrates and organic pollution • Benthic algae (diatoms) and nutrients • Benthic invertebrates and toxic pollution (heavy metals) • Coastal waters: • Phytoplankton and nutrients
spring/early summer samples Chrysophytes (excl. Synura and Uroglena) Cyanophytes (excl. Chroococcales but incl. Microcysta and Woronichinia) H/G G/M % of biovolume Pennate diatoms late summer samples Chlorophyll-a µg L-1 Lakes: Phytoplankton and nutrients • Phytoplankton taxonomic indicator responses (Ptacnik et al. 2008, Lyche-Solheim et al. 2008)
Lakes: Macrophytes and nutrients Macrophyte indicator (Isoetids) responses in low alkalinity lakes (Penning et al. 2008)
Rivers: benthic invertebrates • Benthic invertebrates integrated common metric index (ICMi) response to organic pollution (Buffagni & Owen, R. 2007)
Rivers: Benthic algae and nutrients • Diatom responses (Deflandre-Vlandas et al. submitted)
Rivers: benthic invertebrates and toxic pollution • Benthic invertebrates and impact of heavy metals (Cu) in a Norwegian river exposed to mining waste (Moe et al. submitted)
Coastal waters: Phytoplankton and nutrients • Bloom frequency and biomass increases with total nitrogen concentrations (Carstensen et al. 2006)
Coastal waters: Macroalgae and nutrients • Macroalgae response to nitrogen (Krause-Jensen et al.)
How to use automated methods? • Essential to establish good correlations between the automated method parameter and the biological indicators used in the new WFD classification systems • Automated methods that are well correlated to the biological indicators may enhance spatial and temporal resolution of monitoring data, and allow detection of effect of measures • Two examples of automated methods: • Monitoring phytoplankton in coastal waters in Norway using satellite images and sensors on ferries • Mapping the riparian corridor as a proxy for ecological status of rivers
Sensors for marine phytoplankton • Sensors on ferries detect algal blooms in the Oslofjord (green line) in contrast to conventional sampling programmes (red dots in figure) (Sørensen 2008)
Satellite images for marine phytoplankton • Algal biomass in Skagerak during spring bloom 2008 (Sørensen in prep., www.ferrybox.no)
Mapping of the riparian corridor as a proxy for ecological status of rivers • From JRC IES Agri-Env action on Impact assessment and riparian mapping using time series of remote sensing (Ivits-Wasser et al.) • Permanent vegetation fraction derived from remote sensing correlates to the favourable status • Classification of the riparian-zone into favourable and unfavourable status in the Andalusia river network based on field observations • Classification accuracy: 89% favourable status unfavourable status