Download
1 / 1

E N D
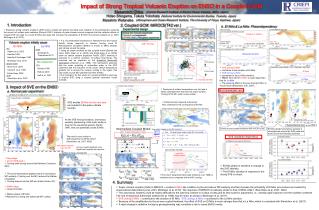
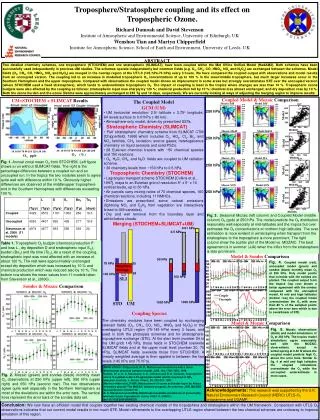
Two detailed chemistry schemes, one tropospheric (STOCHEM) and one stratospheric (SLIMCAT), have been coupled within the Met Office Unified Model (HadAM3). Both schemes have been successfully used independently in previous UM studies. The schemes operate independently but common fields (e.g. O3, CH4, CO, HNO3, NOx and N2O5) are exchanged between the schemes. Model fields (O3, CH4, CO, HNO3, NOx and N2O5) are merged in the overlap region of the UT/LS (145 hPa-75 hPa) every 3 hours. We have compared the coupled output with observations and model results from an uncoupled version. The coupling led to an increase in modelled tropospheric O3 concentrations of up to 100 % in the lower/middle troposphere, but much larger increases occur in the Southern Hemisphere and the upper troposphere. Compared with observations the coupled model shows an improvement in some areas but strongly overestimates STE over the uncoupled version (where STOCHEM used a fixed stratosphere), which tends to underestimate tropospheric O3. The impact of coupling is least in the tropics where changes are less than 10 %. Tropospheric ozone budgets were also affected by the coupling as follows: stratospheric input rose sharply by 120 %; chemical production fell by 10 %; chemical loss almost unchanged; and dry deposition rose by 10 %. Both the ozone burden and the ozone lifetime were approximately unchanged at 285 Tg and 19 days, respectively. We are currently looking at ways of adjusting the merging region to improve results. The Coupled Model GCM (UM) • UM horizontal resolution: 2.5o latitude x 3.75o longitude; 64 levels surface to 0.01hPa (~80 km). • Atmosphere-only model, driven by prescribed SSTs. Stratospheric Chemistry (SLIMCAT) • ‘Full’ stratospheric chemistry scheme from SLIMCAT CTM [Chipperfield, 1999] which includes Ox, HOx, Cly, Bry, and NOy families, CH4 oxidation; source gases; heterogeneous chemistry on liquid aerosols and solid PSCs. • 28 Eulerian chemical tracers with ~50 chemical species and 150 reactions. • O3, H2O, CH4, and N2O fields are coupled to UM radiation scheme. • 30 chemistry levels from ~150 hPa to 0.5 hPa. Tropospheric Chemistry (STOCHEM) • Lagrangian transport scheme STOCHEM [Collins et al., 1997], maps to an Eulerian grid of resolution 5° x 5° x 10 vertical levels, up to 50 hPa. • Air parcels carry mixing ratios of 70 chemical species, 160 chemical reactions, including 11 NMHCs. • Emissions are prescribed, some natural emissions (lightning NOx and C5H8 from vegetation are interactively linked to UM variables). • Dry and wet removal from the boundary layer and within/below clouds. Merging (STOCHEM+SLIMCAT+UM) Mozaic DJF Model DJF DJF 1600 1400 1200 1000 800 600 400 200 100 60 20 0 1600 1400 1200 1000 800 600 400 200 100 60 20 0 800 600 400 200 250 hPa Model 100 200 300 MOZAIC Mozaic MAM Model MAM MAM 1600 1400 1200 1000 800 600 400 200 100 60 20 0 1600 1400 1200 1000 800 600 400 200 100 60 20 0 800 600 400 200 250 hPa Model 100 300 500 MOZAIC Mozaic JJA Model JJA JJA 1600 1400 1200 1000 800 600 400 200 100 60 20 0 1600 1400 1200 1000 800 600 400 200 100 60 20 0 Fig. 1. Annual zonal mean O3 from STOCHEM. Left figure shows a run without SLIMCAT fields. The right is the percentage difference between a coupled run and an uncoupled run. In the tropics the two modules seem to agree quite well with difference within 10 %. Obviously higher differences are observed at the middle/upper troposphere and in the Southern Hemisphere with differences exceeding 100 %. Fig. 3. Seasonal Mozaic (left column) and Coupled Model (middle column) O3 (ppb) at 250 hPa. The model predicts the O3 distribution reasonably well especially at mid-latitudes and the tropics but over estimates the O3 concentrations at northern high latitudes. The over estimation is more evident in winter/spring when transport from the stratosphere to the troposphere is more prominent. The right column show the scatter plot of the Model vs. MOZAIC. The best agreement is in summer (JJA) when the influx from the stratosphere is less prominent. 250 hPa 800 400 200 Model 100 300 500 MOZAIC Mozaic SON Model SON SON 1600 1400 1200 1000 800 600 400 200 100 60 20 0 1600 1400 1200 1000 800 600 400 200 100 60 20 0 800 600 400 200 250 hPa Model 100 300 500 MOZAIC 0.01 hPa Fig. 2. Mozaic (green) and sondes (black) monthly mean O3 observations at 250 hPa (upper left), 550 hPa (upper right) and 650 hPa (second row). The two observations agree quite well especially in the Northern Hemisphere as most of the deviations are within the error bars. The vertical lines represent the error bars of the sondes data set. 0.5 hPa -10 10 30 50 70 90 100 120 160 200 O3 (%) 10 30 50 70 90 110 120 130 140 O3 ppb Table 1. Tropospheric O3 budget (chemical production P and loss L , dry deposition D and stratospheric input Sin), burden (Bo3) and life time (To3). As a result of the coupling, stratospheric input was most affected with an increase of about 120 %. The rest were approximately unchanged except dry deposition which was increased by 10 % and chemical production which was reduced also by 10 %. The bottom row shows the mean values from 11 models taken from Stevenson et al., (2006). 50 hPa 90 75 hPa 30 Fig. 4. Coupled model (red), uncoupled model (green) and sondes (black) monthly mean O3 at 250 hPa. Only model points that coincide with the sondes are plotted. The coupled output from the tropics (top row) shows a better agreement with the sondes compared with the uncoupled model. At mid and high latitudes (bottom row) the coupled model overestimates the O3 with more than 80 % of the sampled points above the error bars which is due to overstimate of STE. Fig. 5. Mozaic observations (black) and model simulations of O3 at 250 hPa. The tropics model simulations agree reasonably well with the MOZAIC observations except in winter/spring at 0-30 N where the coupled model predicts high O3 above the error bars. Similar to fig. 4 at mid and high latitudes the coupled simulations overestimate the O3 while the uncoupled underestimate in most cases. Weighted Average 80 Couple Uncouple 70 24 145 hPa 60 150 hPa SLI 50 40 30 20 10 1000 hPa 1000 hPa 800 STO UM 700 600 500 400 300 200 100 800 700 600 500 400 300 Conclusion: We now have an efficient model that couples together two existing chemical models of the troposphere and stratosphere within the UM framework. Comparison with UTLS O3 observations indicates that our current model results in too much STE. Model refinements to the overlapping UTLS region shared between the two chemical schemes are underway to improve simulation of this region. 200 100 Acknowledgements: This research was supported by the U.K. Natural Environment Research Council (NERC) UTLS-O3 programme and UGAMP. References:Chipperfield, M. P., Multiannual simulations with a three-dimensional chemical transport model. JGR, 104, 1781-1805, 1999. Collins, W. J., D. S. Stevenson, C. E. Johnson and R. G. Derwent, Tropospheric ozone in a global-scale 3-D Lagrangian model and its response to NOX emission controls, J. Atmos. Chem., 26, 223-274, 1997. Marenco Alain et al.,(1998): Measurement of ozone and water vapor by Airbus in-service aircraft: The MOZAIC airborne program, An overview. JGR, MOZAIC special Section October 98. D. S. Stevenson et al.(2006), Multimodel ensemble simulations of present-day and near-future tropospheric ozone, JGR,111, D08301, doi:10.1029/2005JD006338. Troposphere/Stratosphere coupling and its effect on Tropospheric Ozone. Richard Damoah and David Stevenson Institute of Atmospheric and Environmental Science, University of Edinburgh, UK Wenshou Tian and Martyn Chipperfield Institute for Atmospheric Science, School of Earth and Environment, University of Leeds, UK ABSTRACT Coupled Model & Mozaic Comparison UM+STOCHEM + SLIMCAT Results JJA Model & Sondes Comparison Sondes & Mozaic Comparison Coupling Species The chemistry modules have been coupled by exchanging relevant fields (O3, CH4, CO, NOx, HNO3 and N2O5)in the overlapping UTLS region (75-145 hPa) every 3 hours, and used in both the photolysis schemes and for stratosphere-troposphere exchange (STE). At the start level (number 24 in the UM grid) 145 hPa, those fields in STOCHEM overwrite SLIMCAT fields and at the upper most level (number 30, 75 hPa), SLIMCAT fields overwrite those from STOCHEM. A linearly weighted average is then applied in between the two levels (145 hPa and 75 hPa). Model & Mozaic Comparison